- 1. How to Search
- 2. How to View
- 3. How to Analyze
- 4. How to Add
-
1. How to search your intersted gene by different apporaches
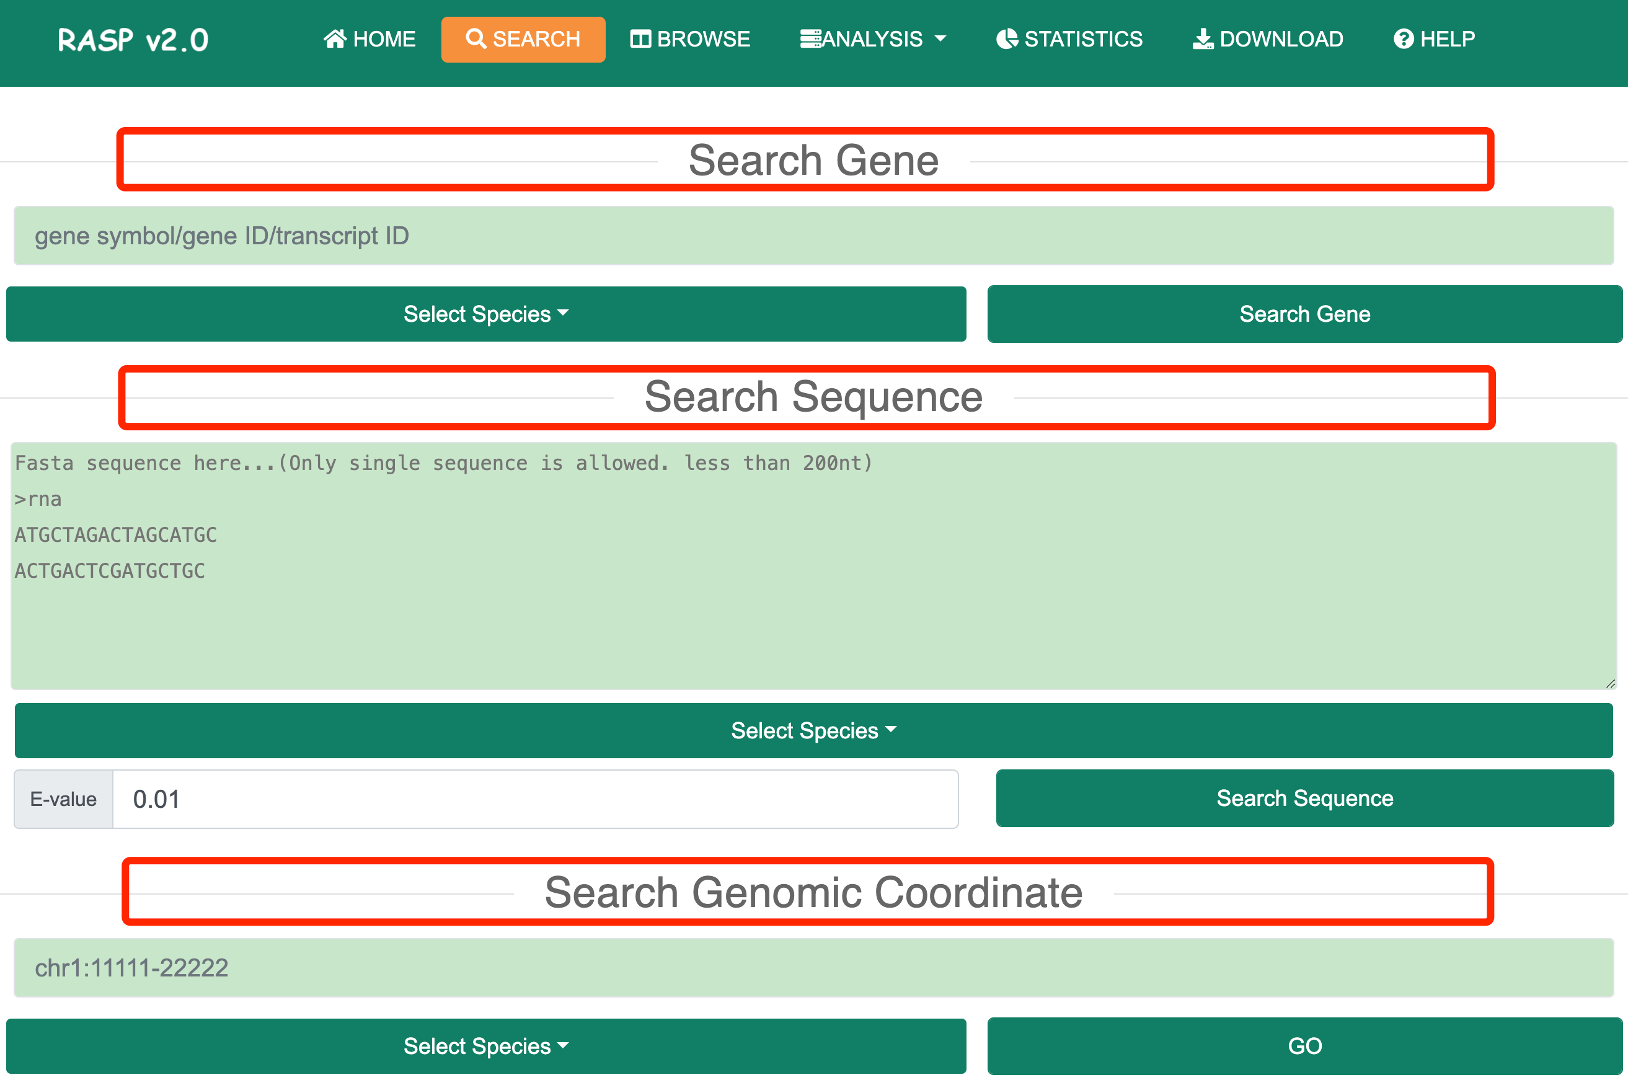
On the "Search" page, users can find the ‘Search’ button in the top menu bar. Upon clicking the “Search” button, the following interface appears. Users can then select from three options: I) Search Gene, II) Search Sequence, or III) Search Coordinate, to retrieve RNA structure probing data in RASP v2.0. After searching through one of the three modes above, the matched item will include the organism name, the genome location, the gene symbol, a transcript list, an structural signals browser link, an intermolecular browser link, and an intramolecular browser link. Users can access the corresponding tutorial through the following link:
1.1 Search by gene symbol
1.2 Search by sequence
1.3 Search by coordinate
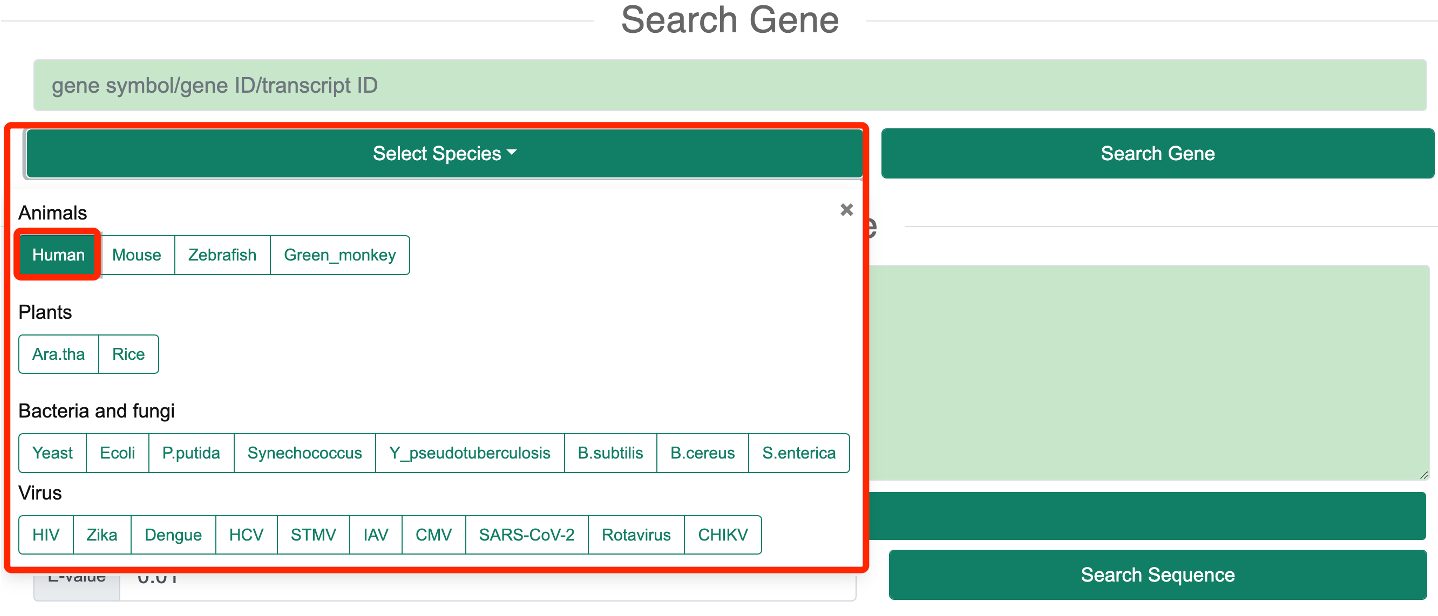
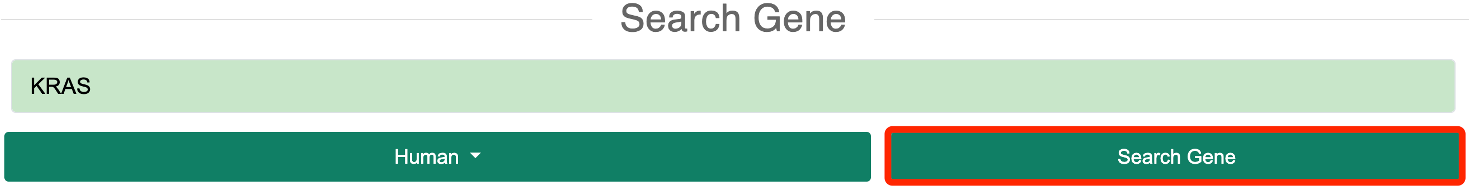
1.1 Search GeneStep 1: In the ‘Search Gene’ mode, users need to select one or more species of interest based on the species information provided by RASP v2.0.
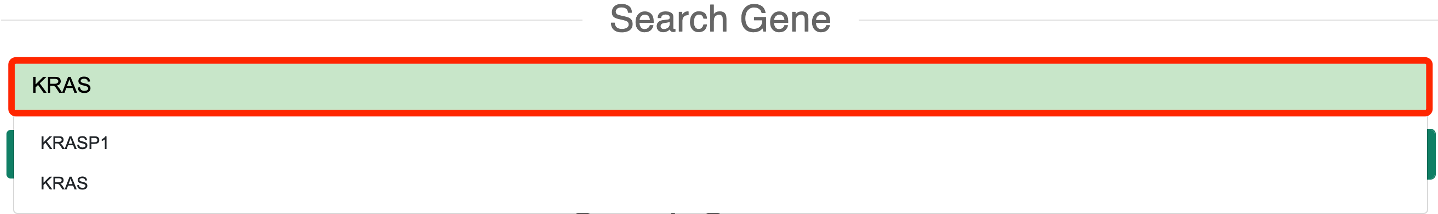
Step 2: The user needs to input a gene symbol, Ensembl gene ID, or transcript ID of interest. A list of genes corresponding to the species will be automatically provided in the input box.
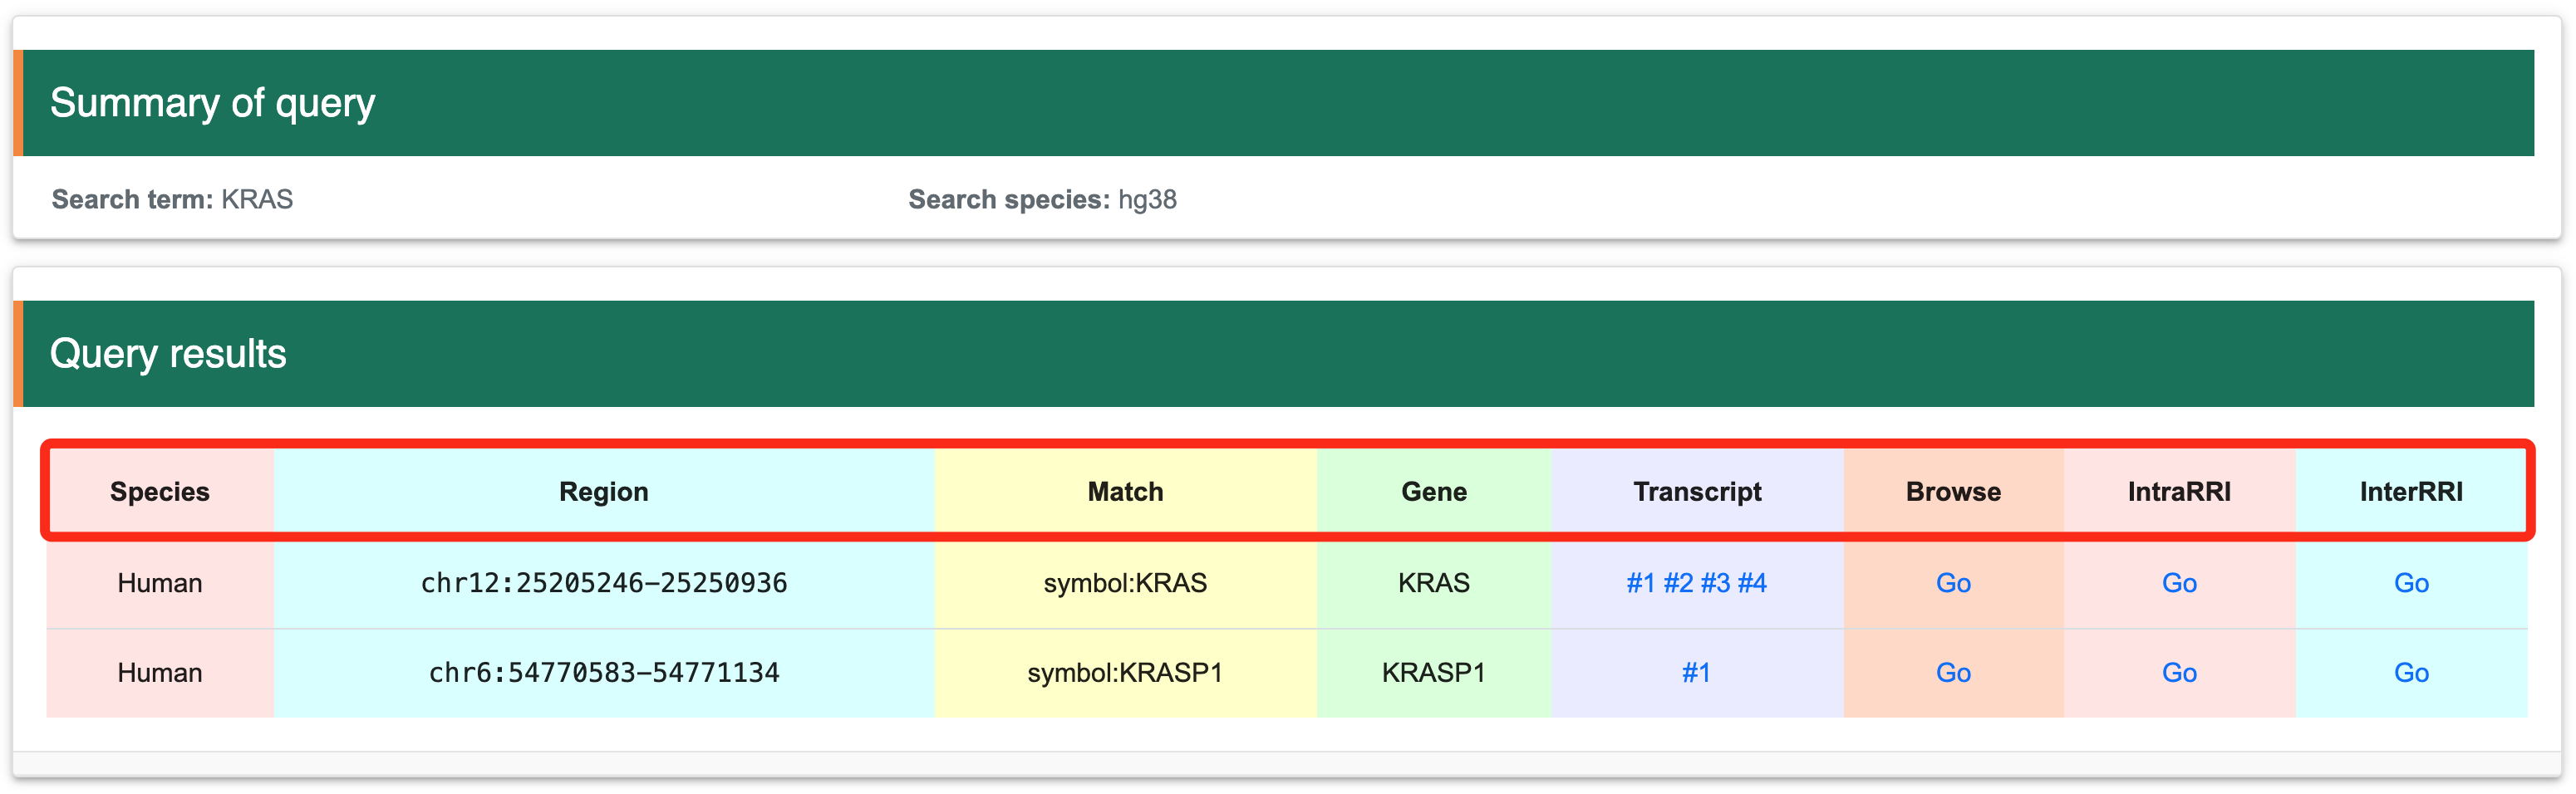
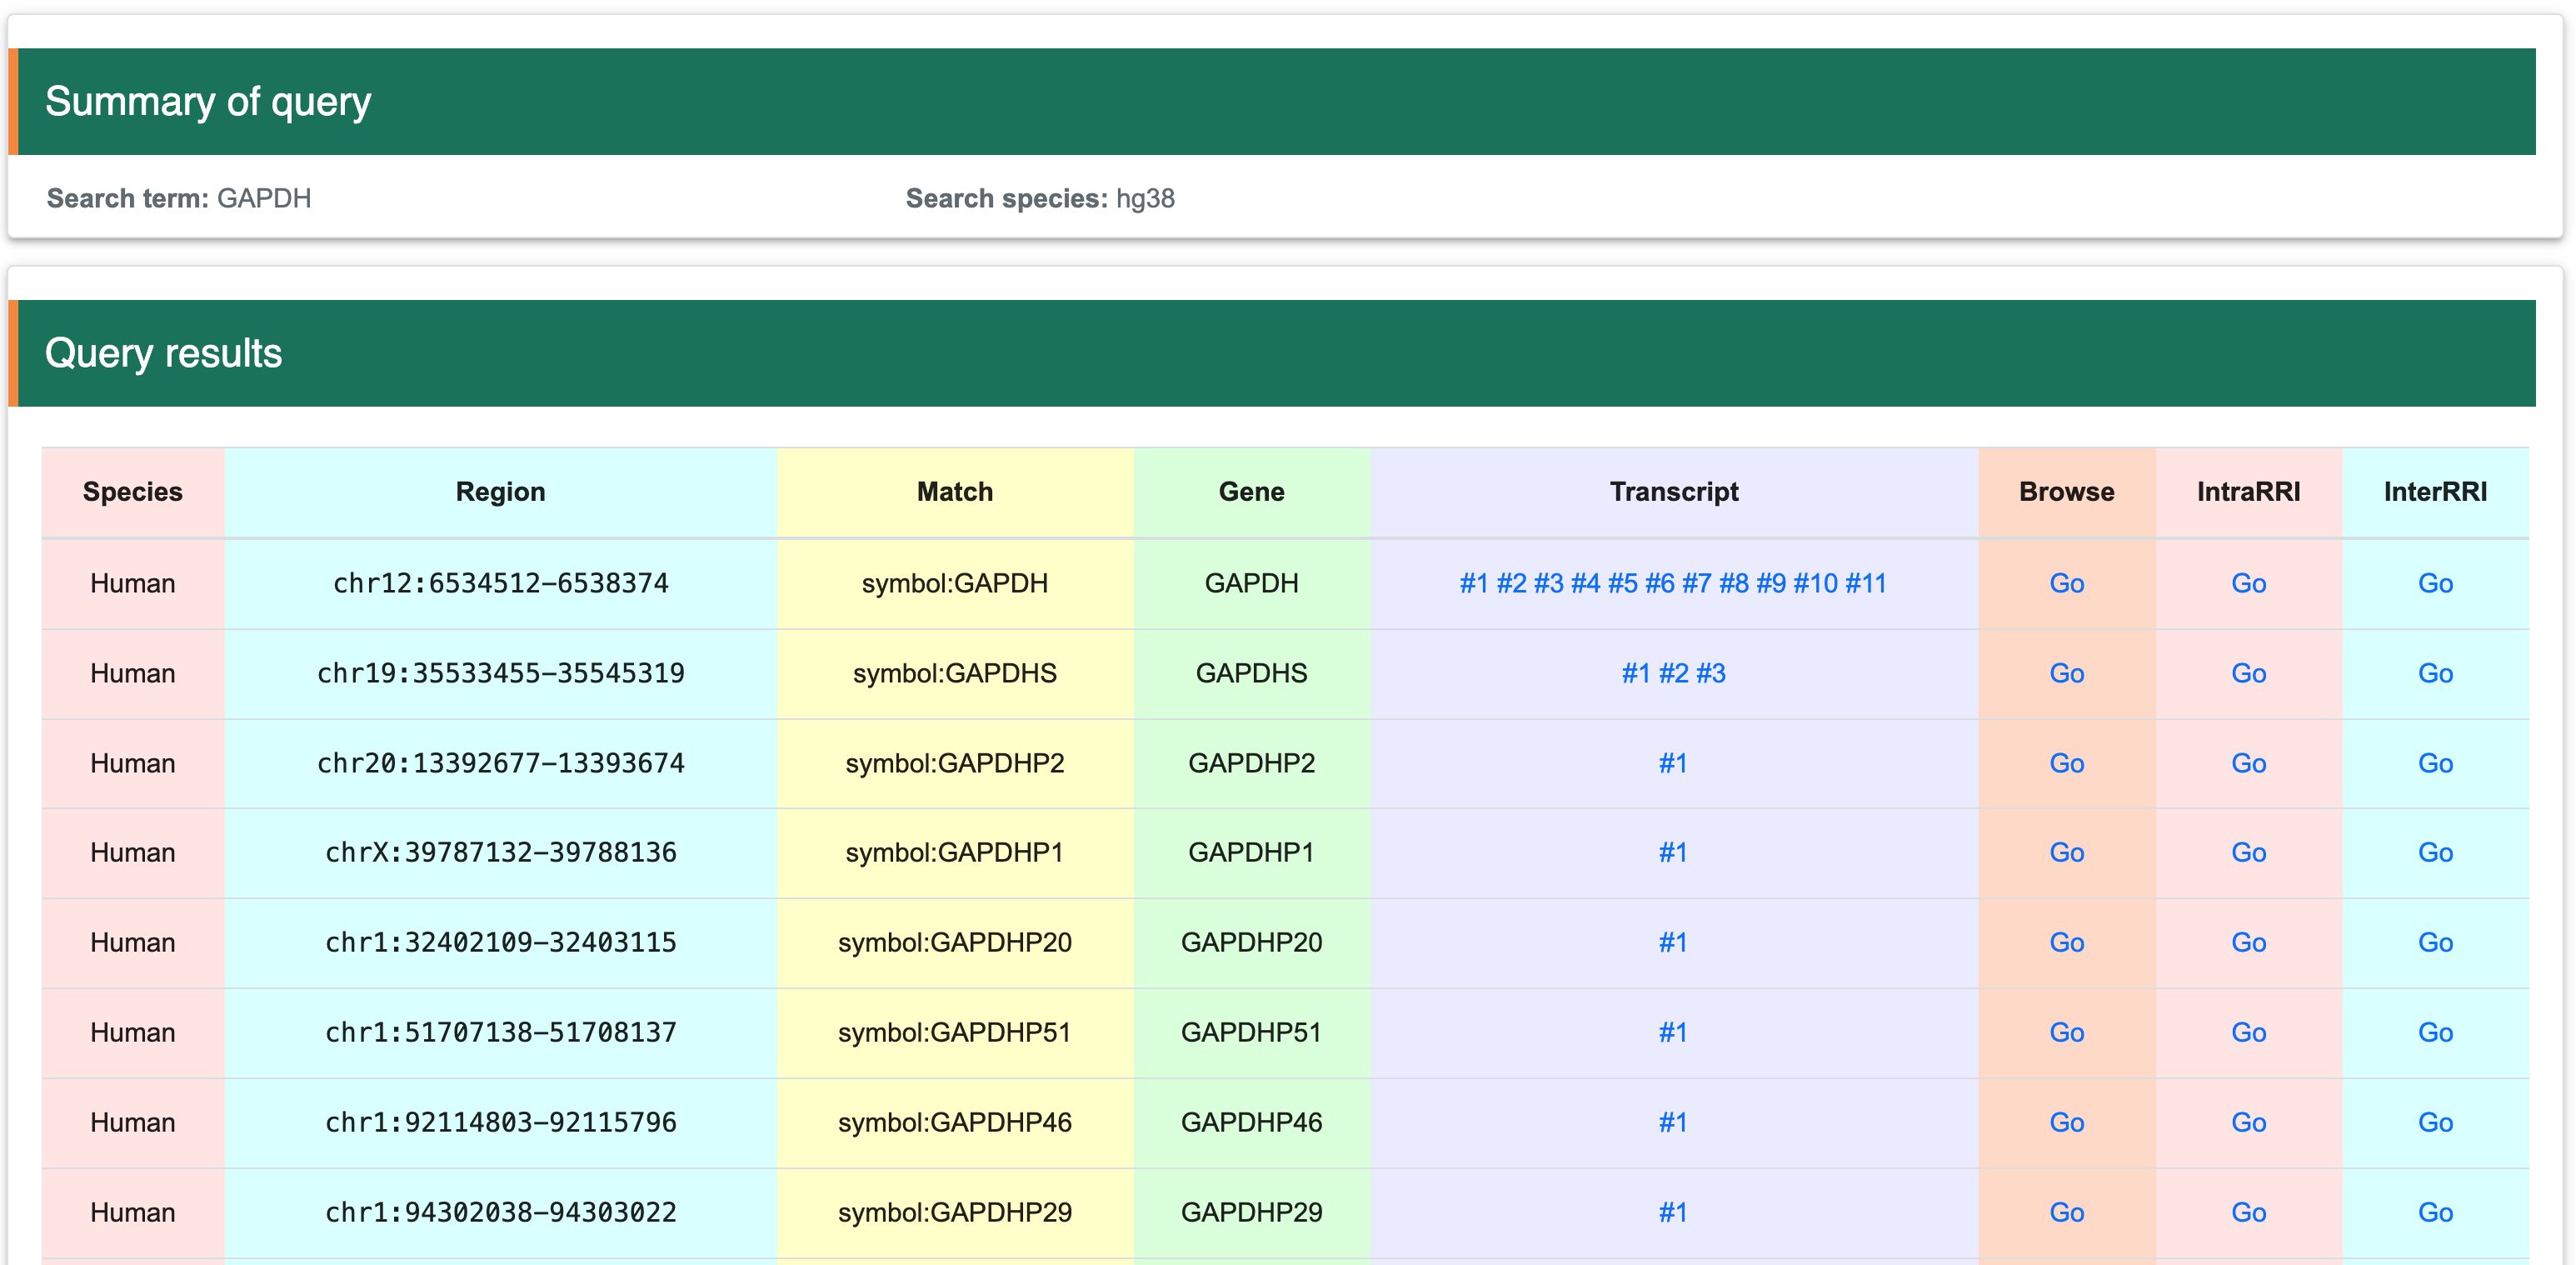
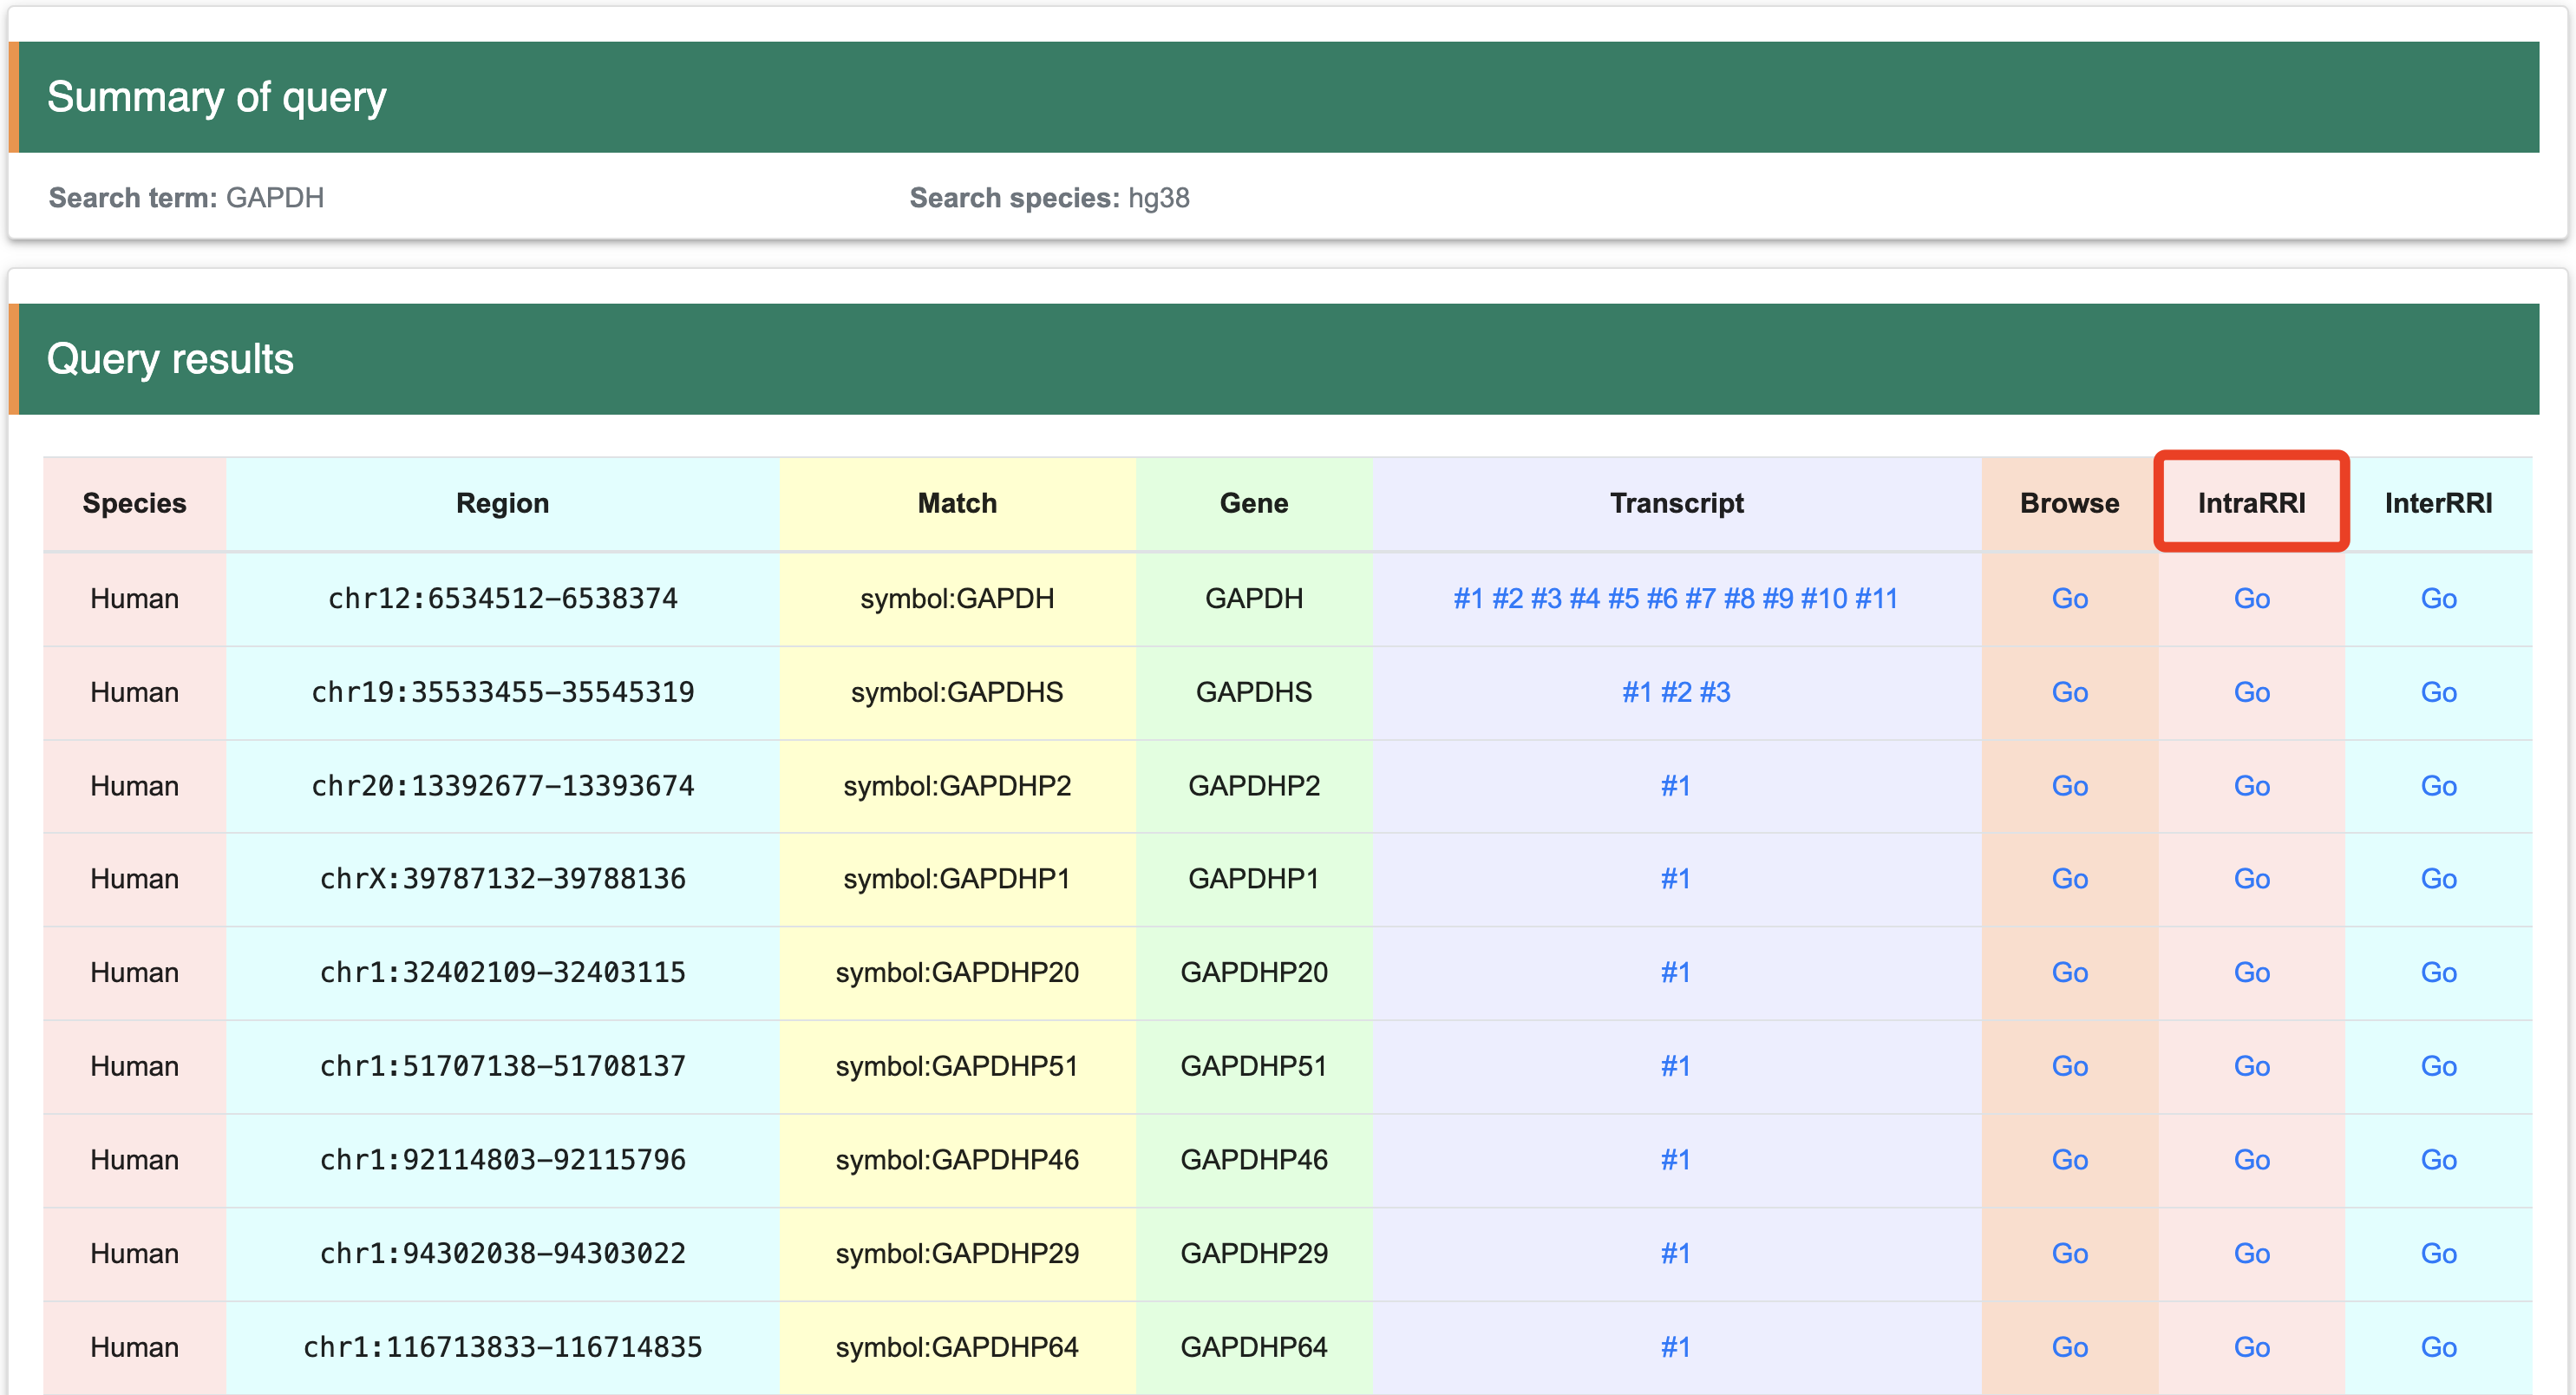
Step 3: After clicking the "Search Gene" button, the database will redirect to the results page.
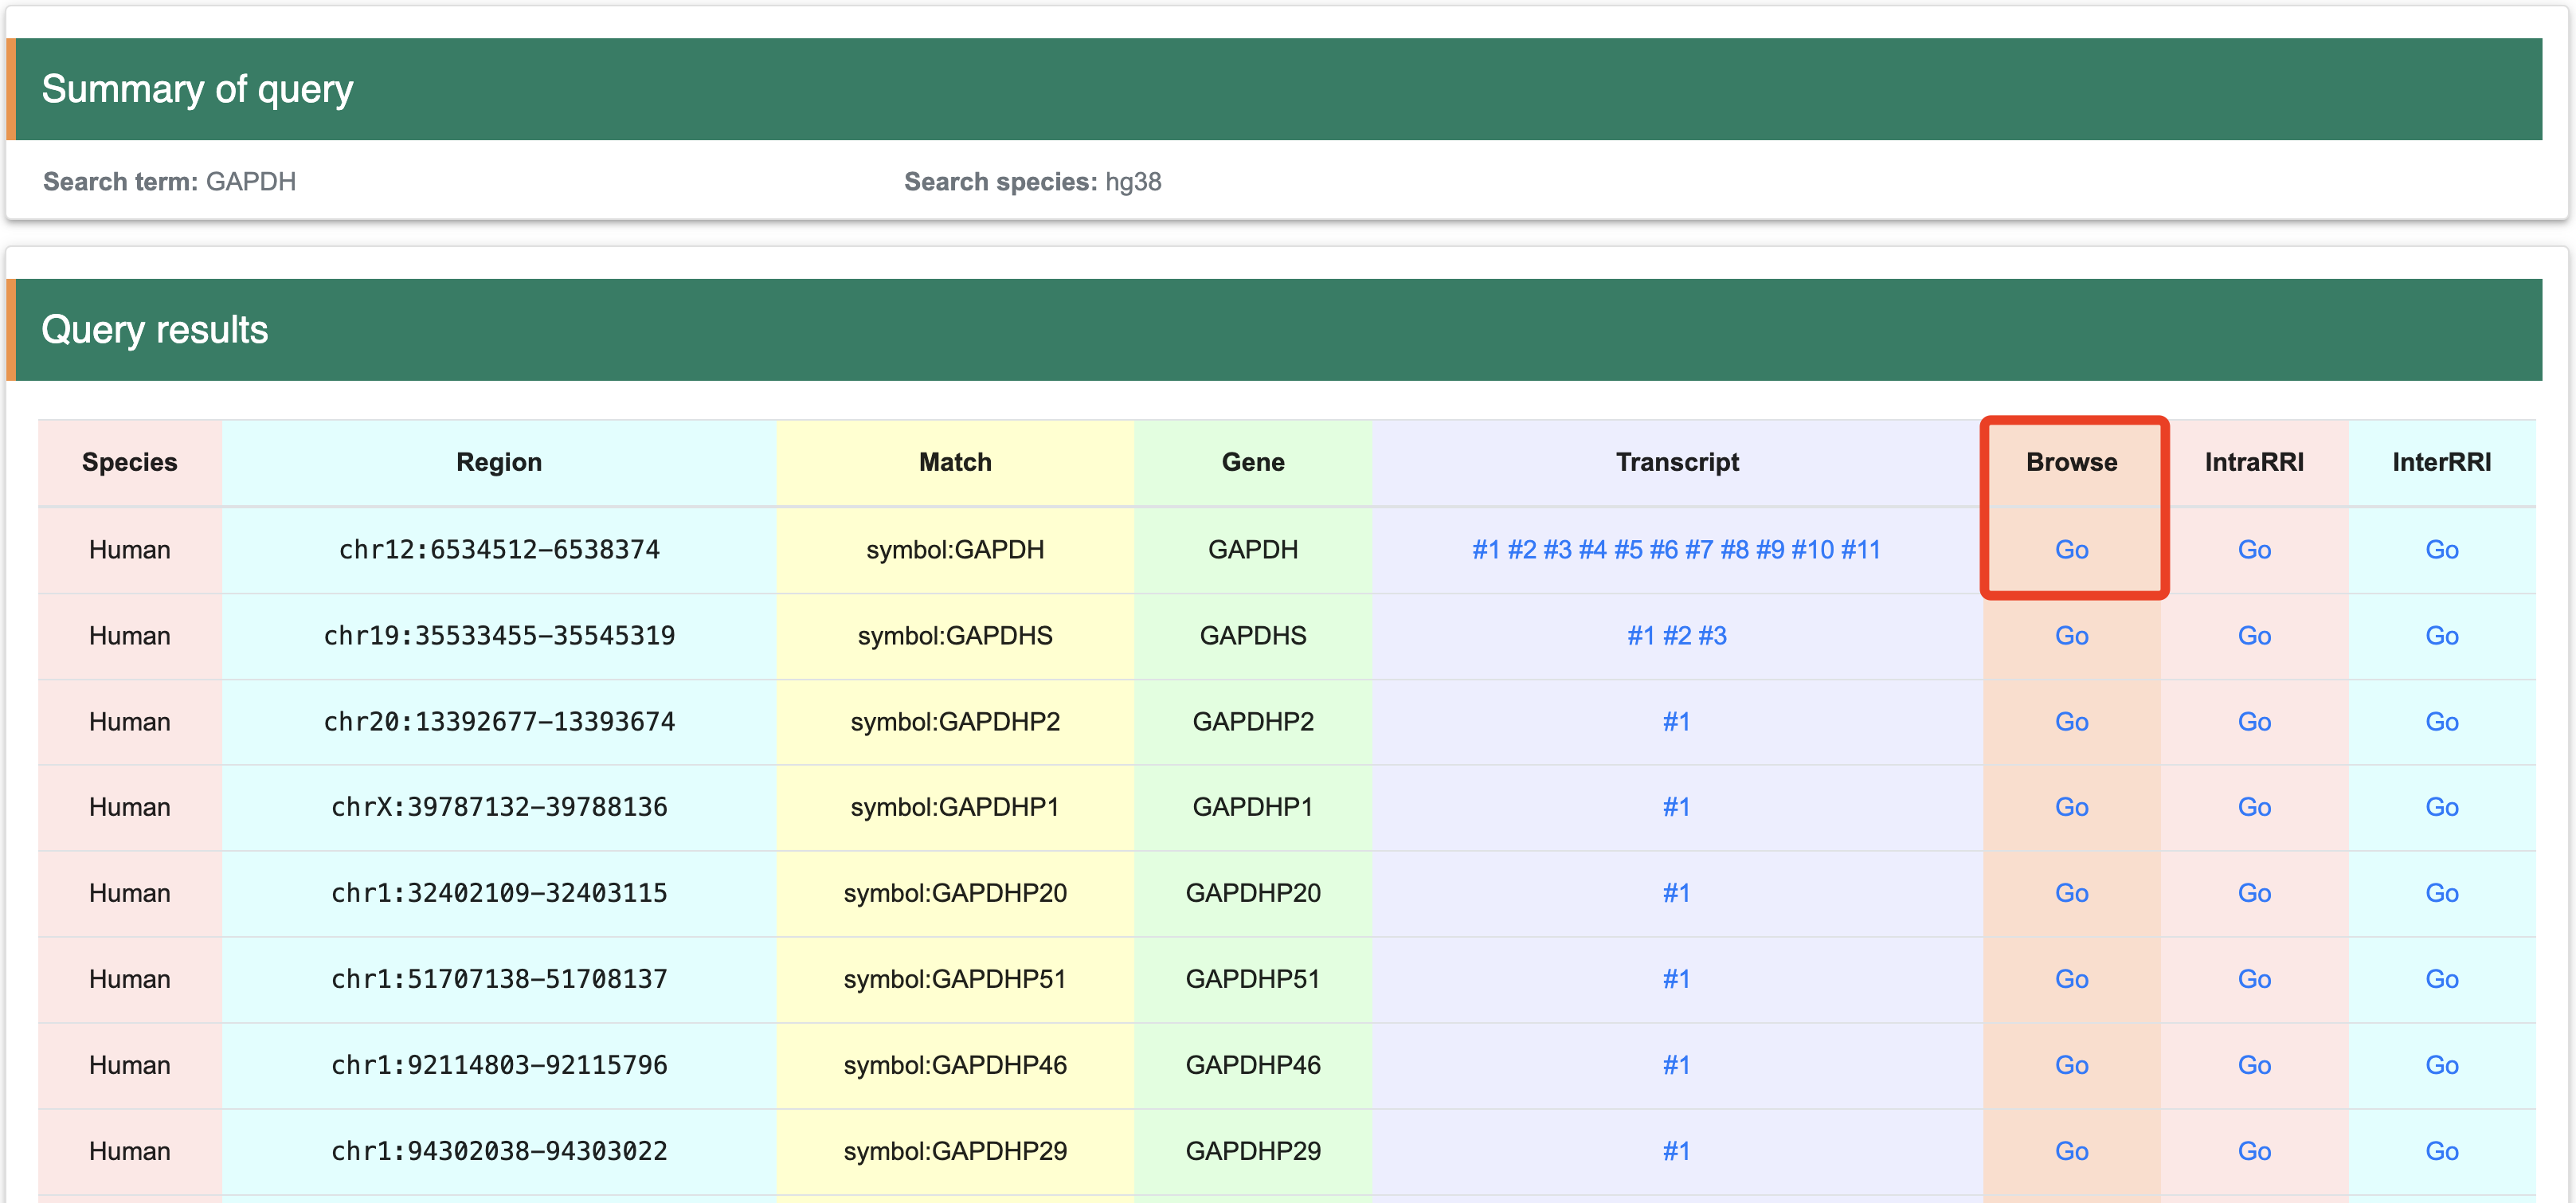
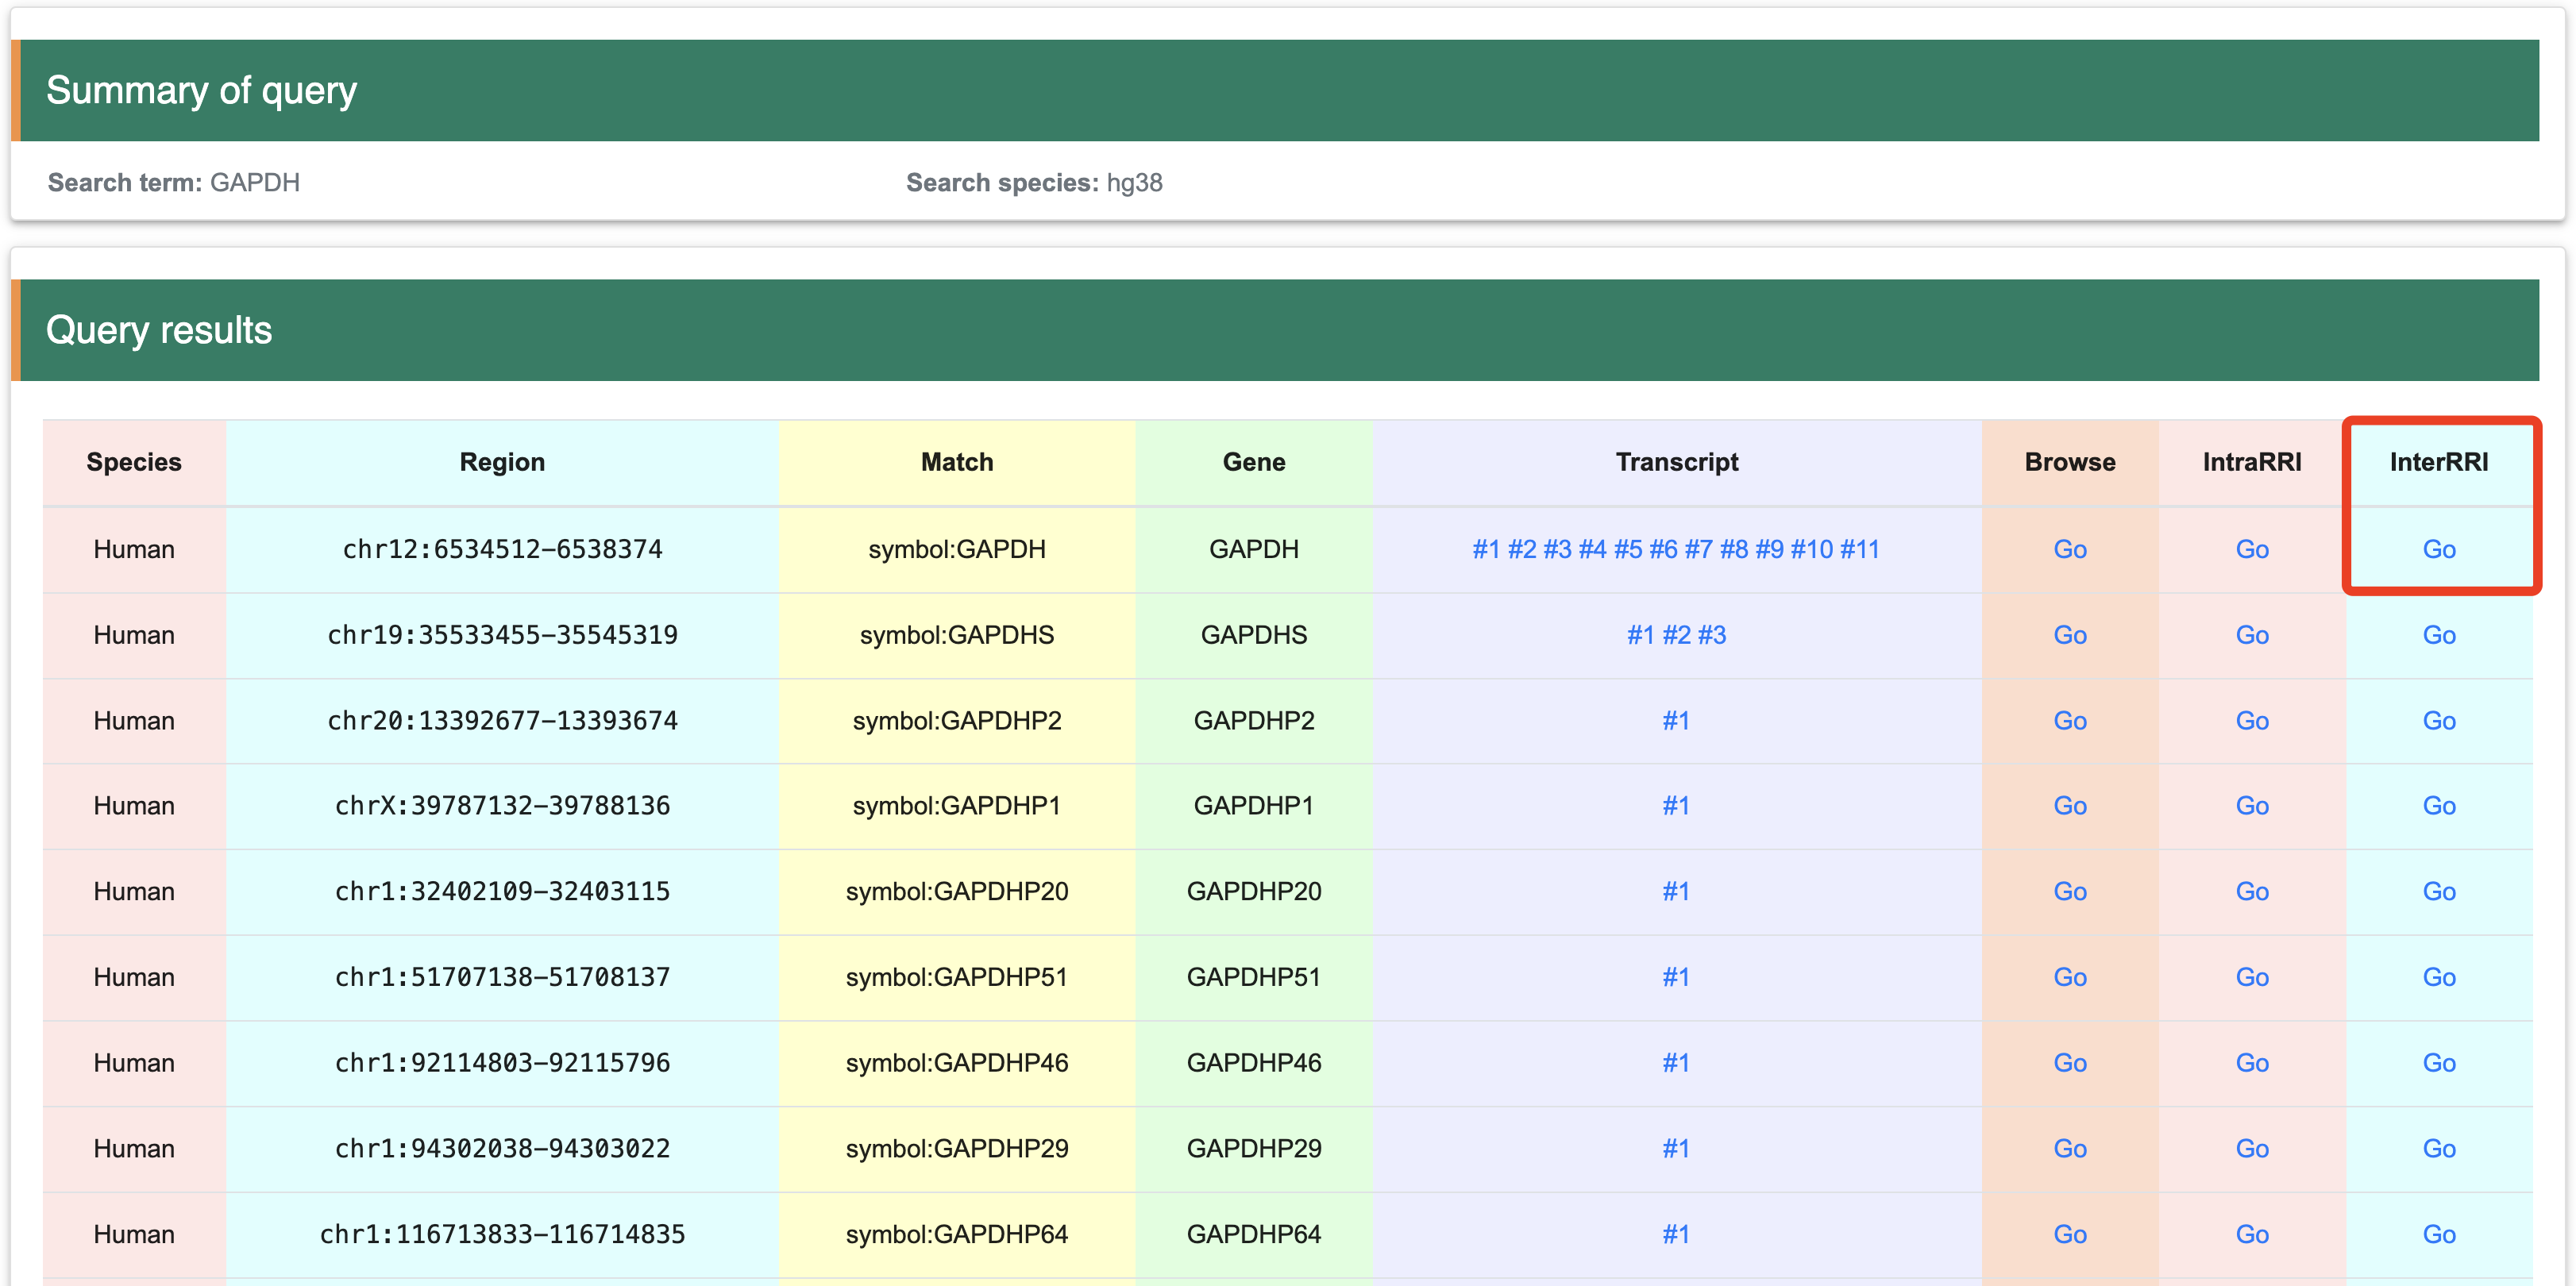
Step 4: The matched items will include the organism name, genome location, gene symbol, transcript list, structure score browser link (Browse), intramolecular RRI browser link (IntraRRI), and intermolecular RRI browser link (InterRRI).
1.2 Search Sequence
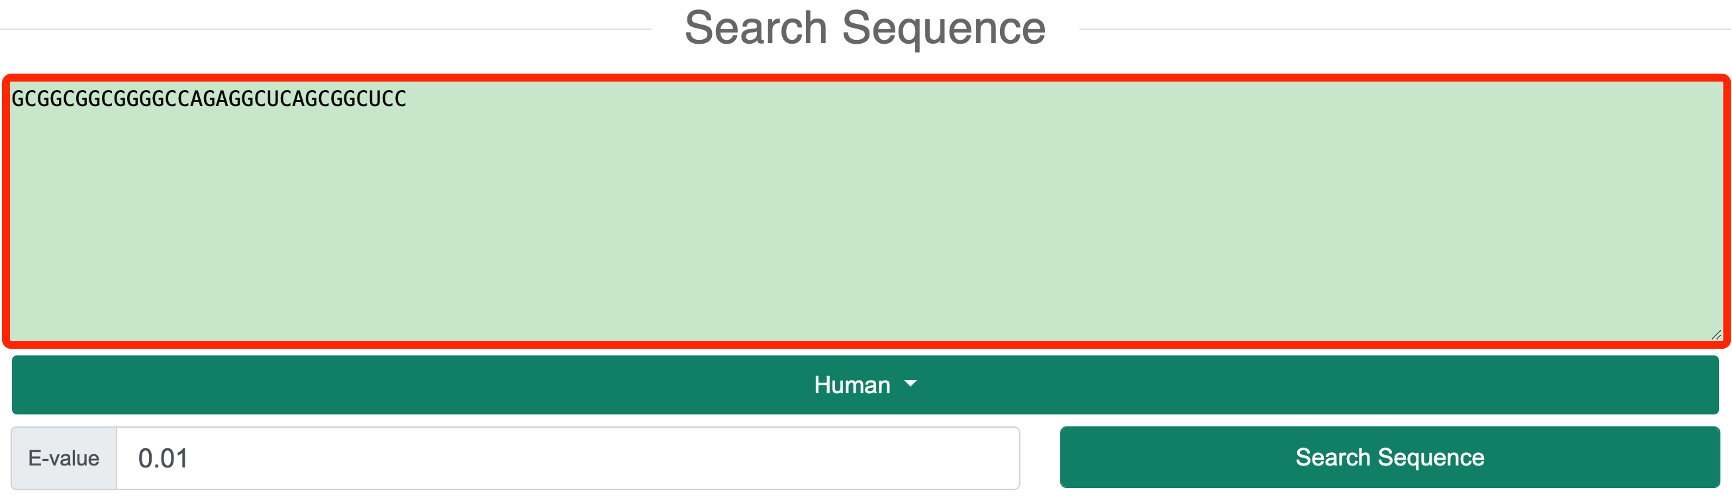
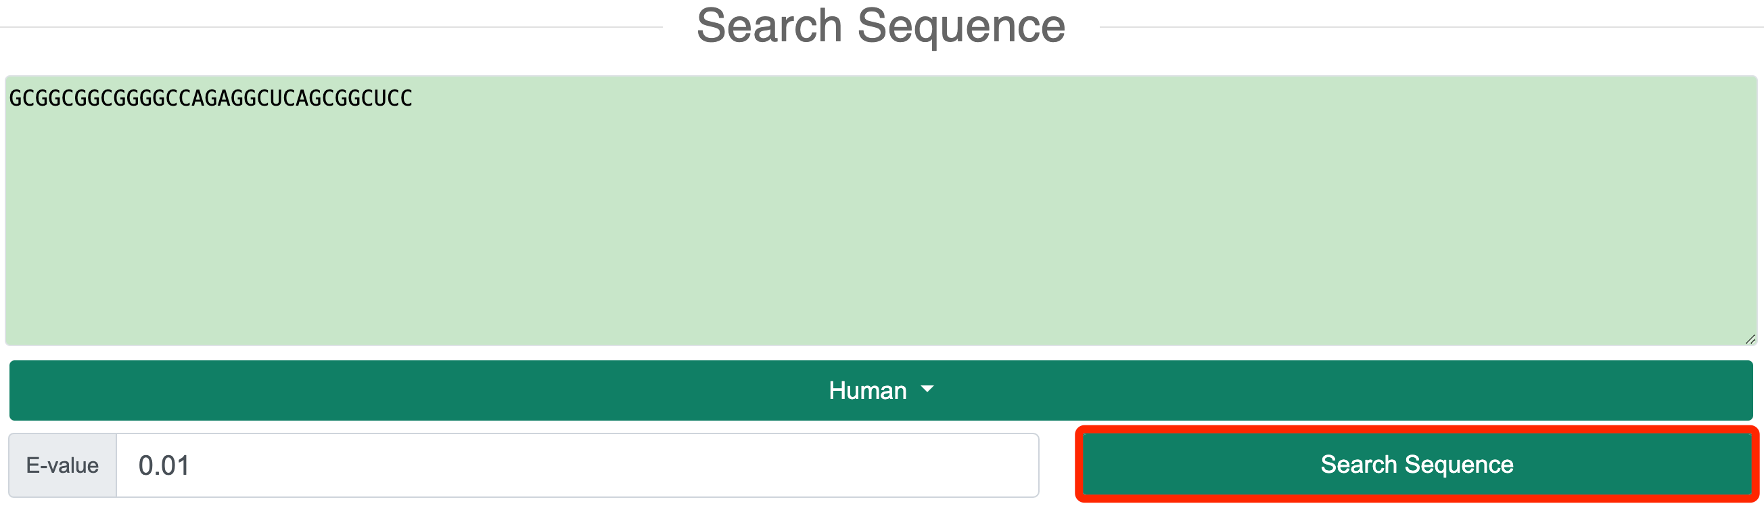
Step 1: In the ‘Search Sequence’ mode, users need to select one or more species of interest based on the species information provided by RASP v2.0.
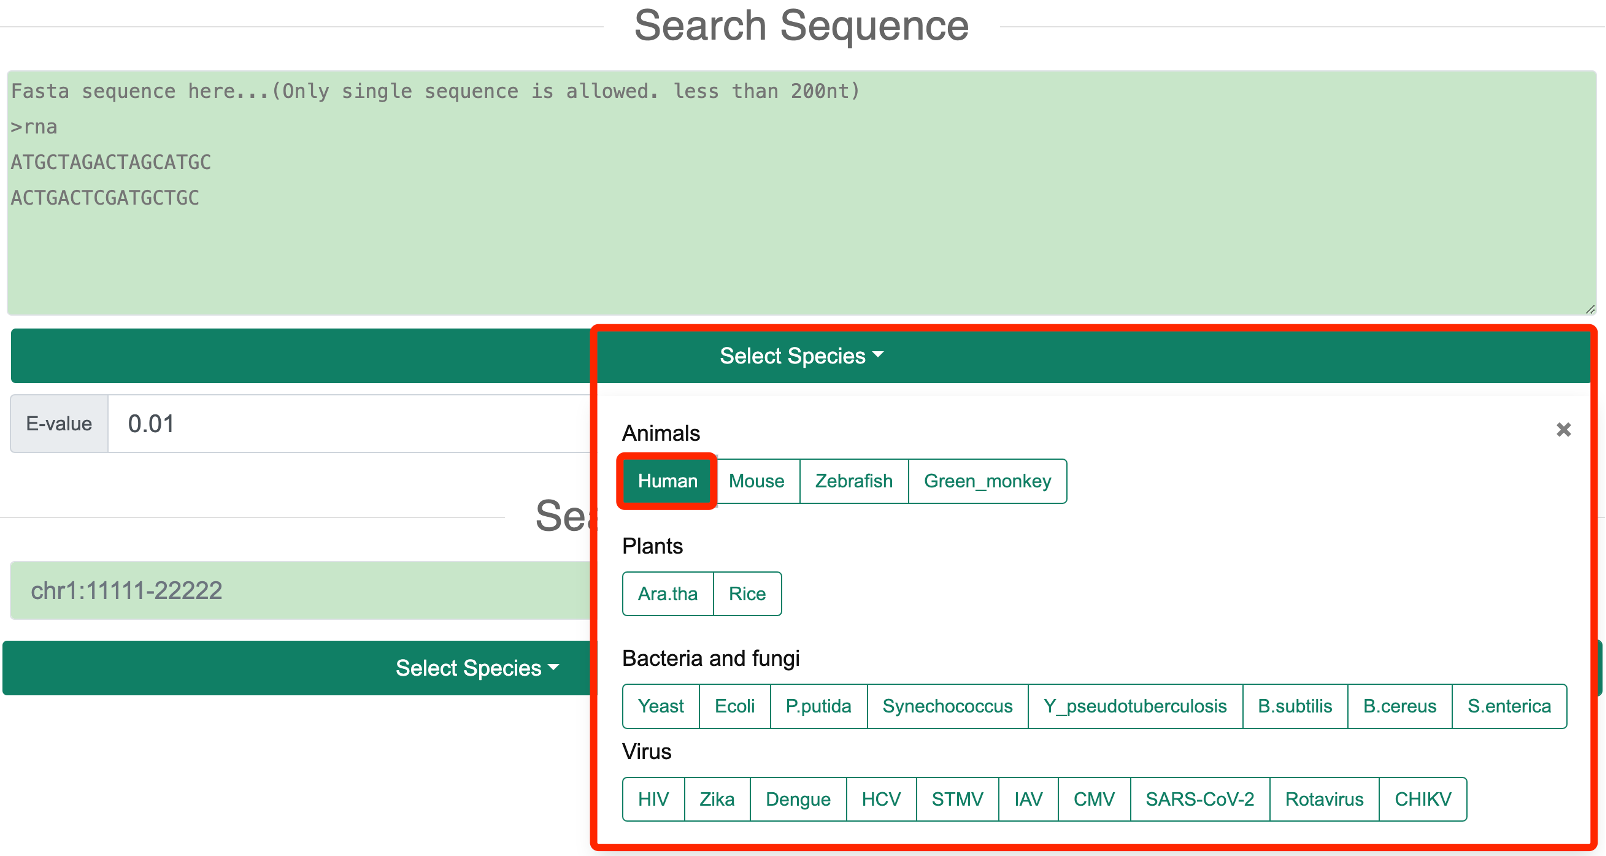
Step 2: The user needs to input a DNA or RNA sequence to search for the inquiry sequence in the genome using BLASTn.
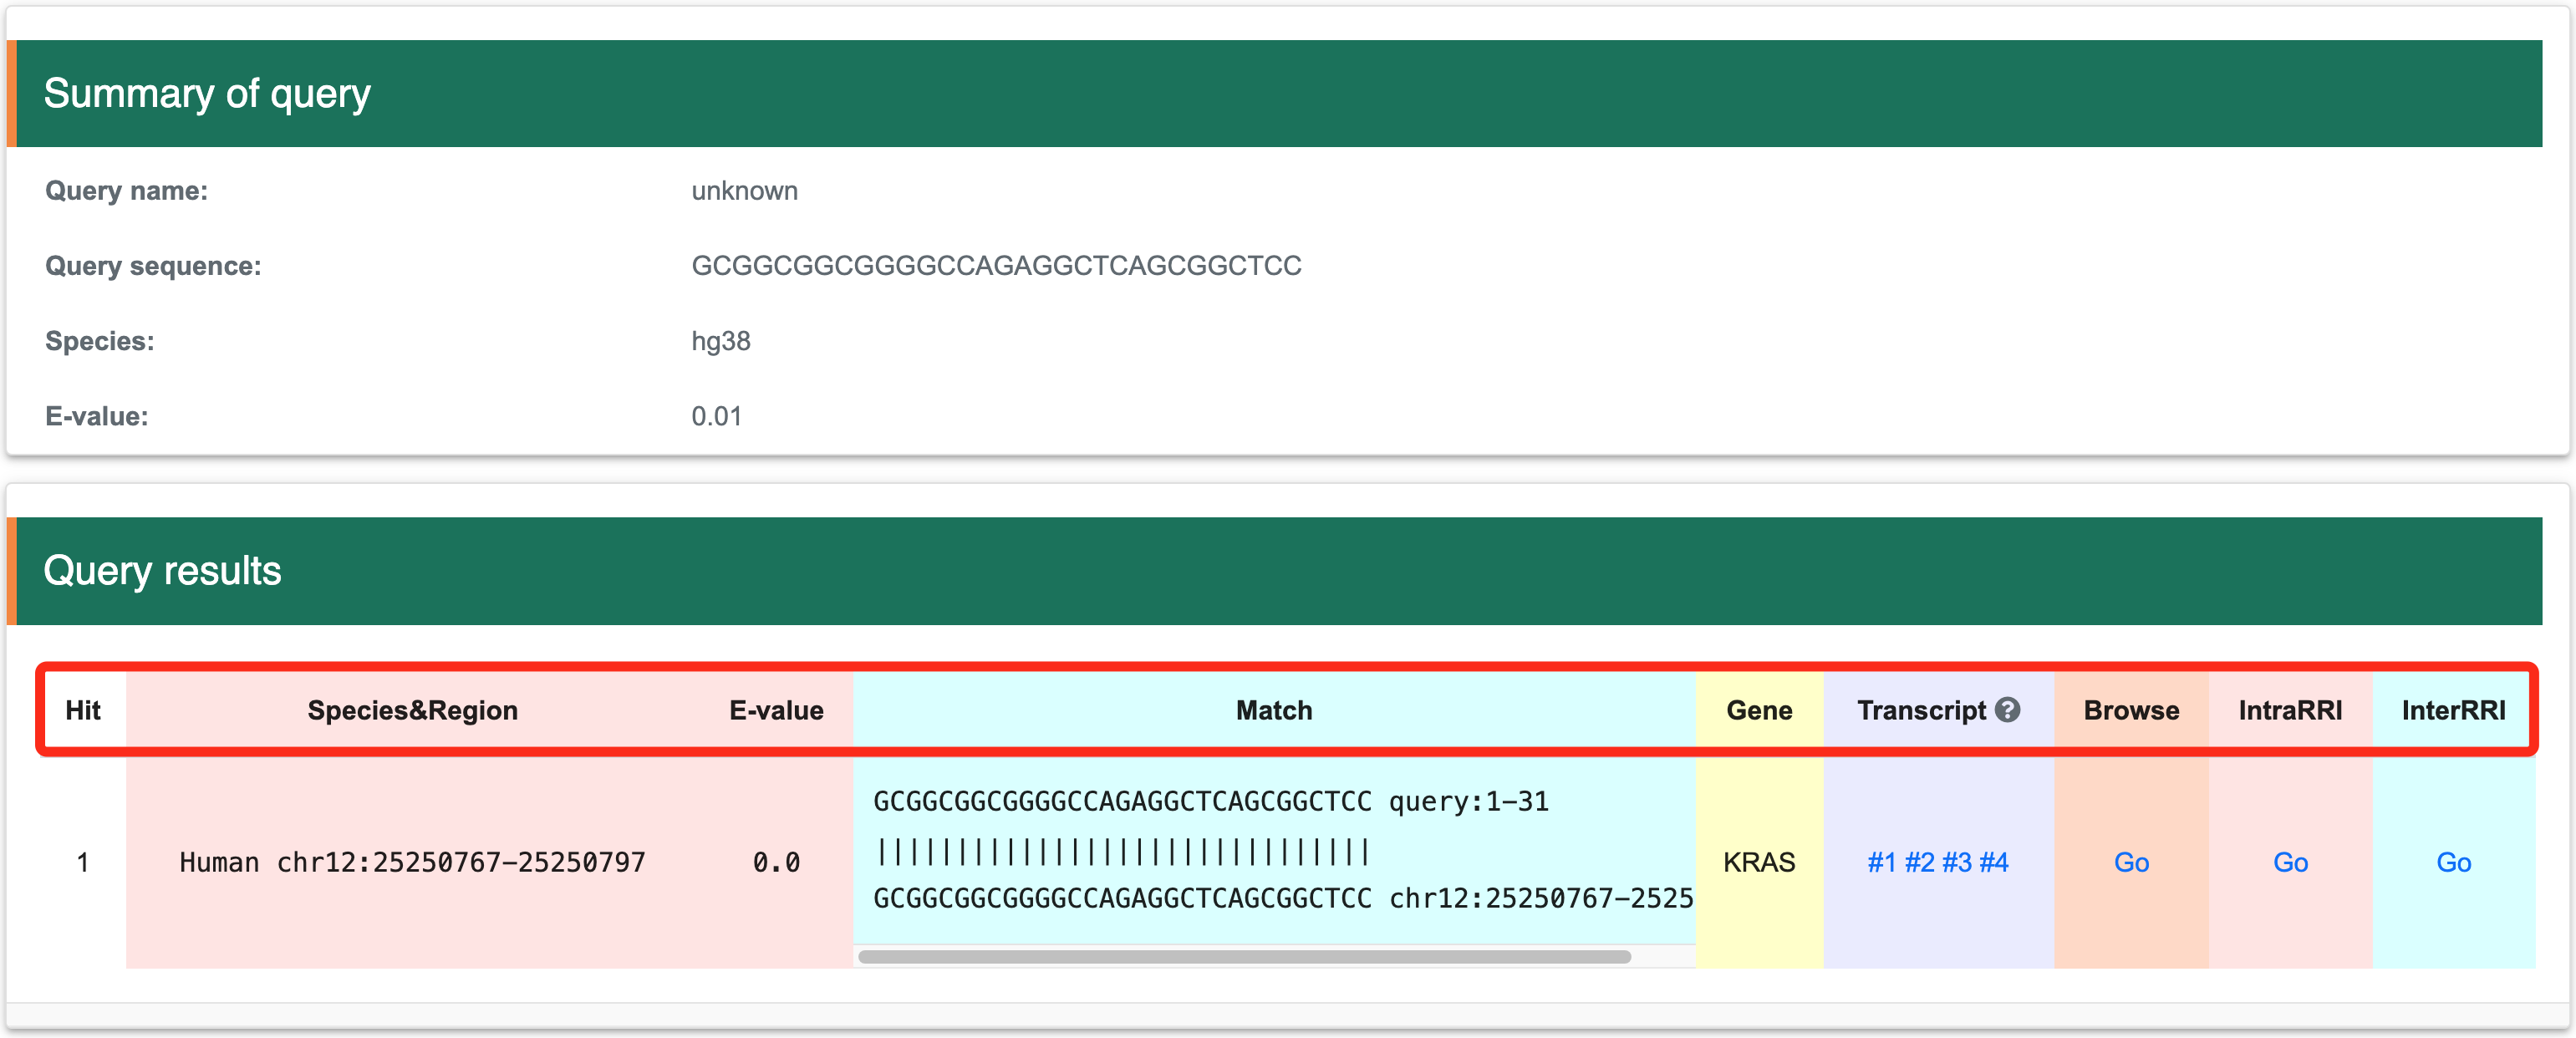
Step 3: The action will return a hit list to the user. Each hit includes the organism name, genome location, E-value, sequence match between the query and target, gene symbol, transcript list, structure score browser link (Browse), intramolecular RRI browser link (IntraRRI), and intermolecular RRI browser link (InterRRI).
Step 4: The matched items will include the organism name, genome location, gene symbol, transcript list, structure score browser link (Browse), intramolecular RRI browser link (IntraRRI), and intermolecular RRI browser link (InterRRI).
1.3 Search Genomic Coordinate
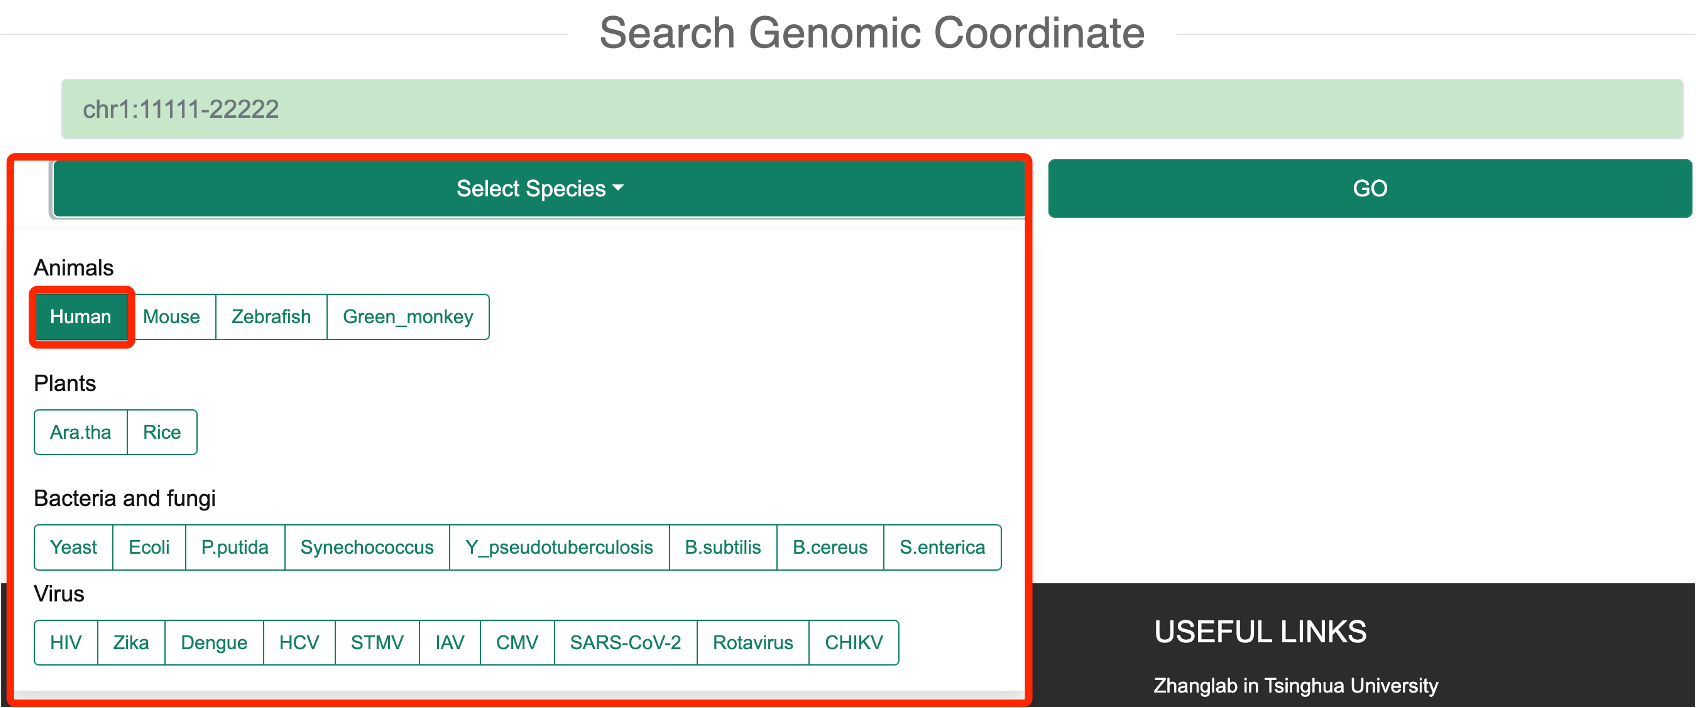
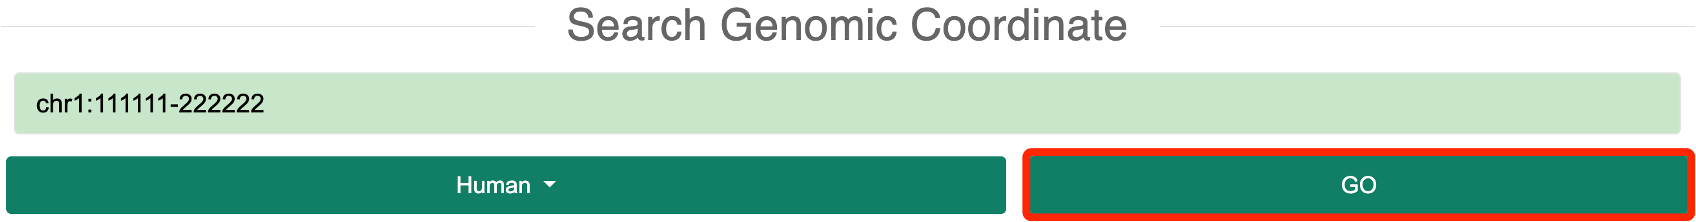
Step 1: In the ‘Search Coordinate’ mode, users need to select one or more species of interest based on the species information provided by RASP v2.0.
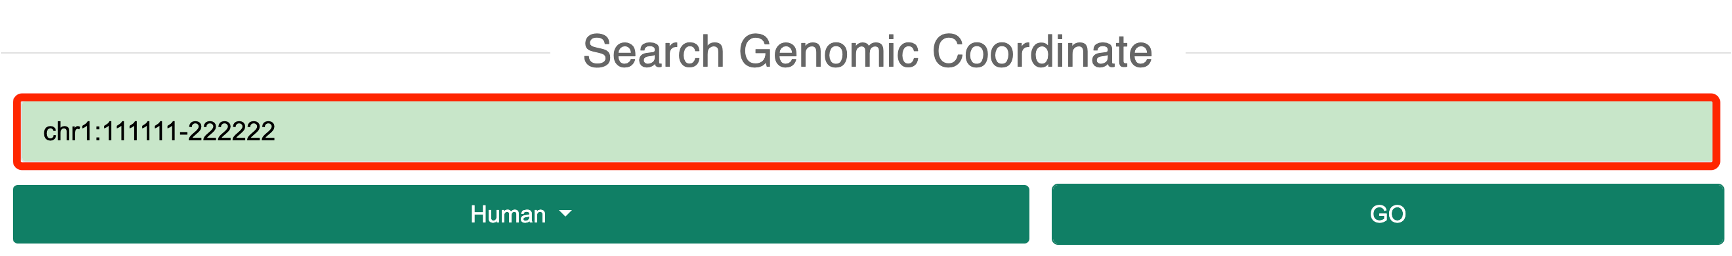
Step 2: the user then needs to enter the coordinates of the genome of interest in the required format (Chromosome Number: Start Position - End Position format, e.g. chr1:1111-2222) and click on “GO” to find the genes covered by that coordinate.
Step 3: After click "GO" botton, database will jump to the results page,The matched item will include the the genome location,gene symbol, a transcript list, an structural signals browser link, an RNA-RNA interaction browser link, which simliar to 'Search Gene' or 'Search Sequence' mode.
-
2. How to view different types of structure probing data
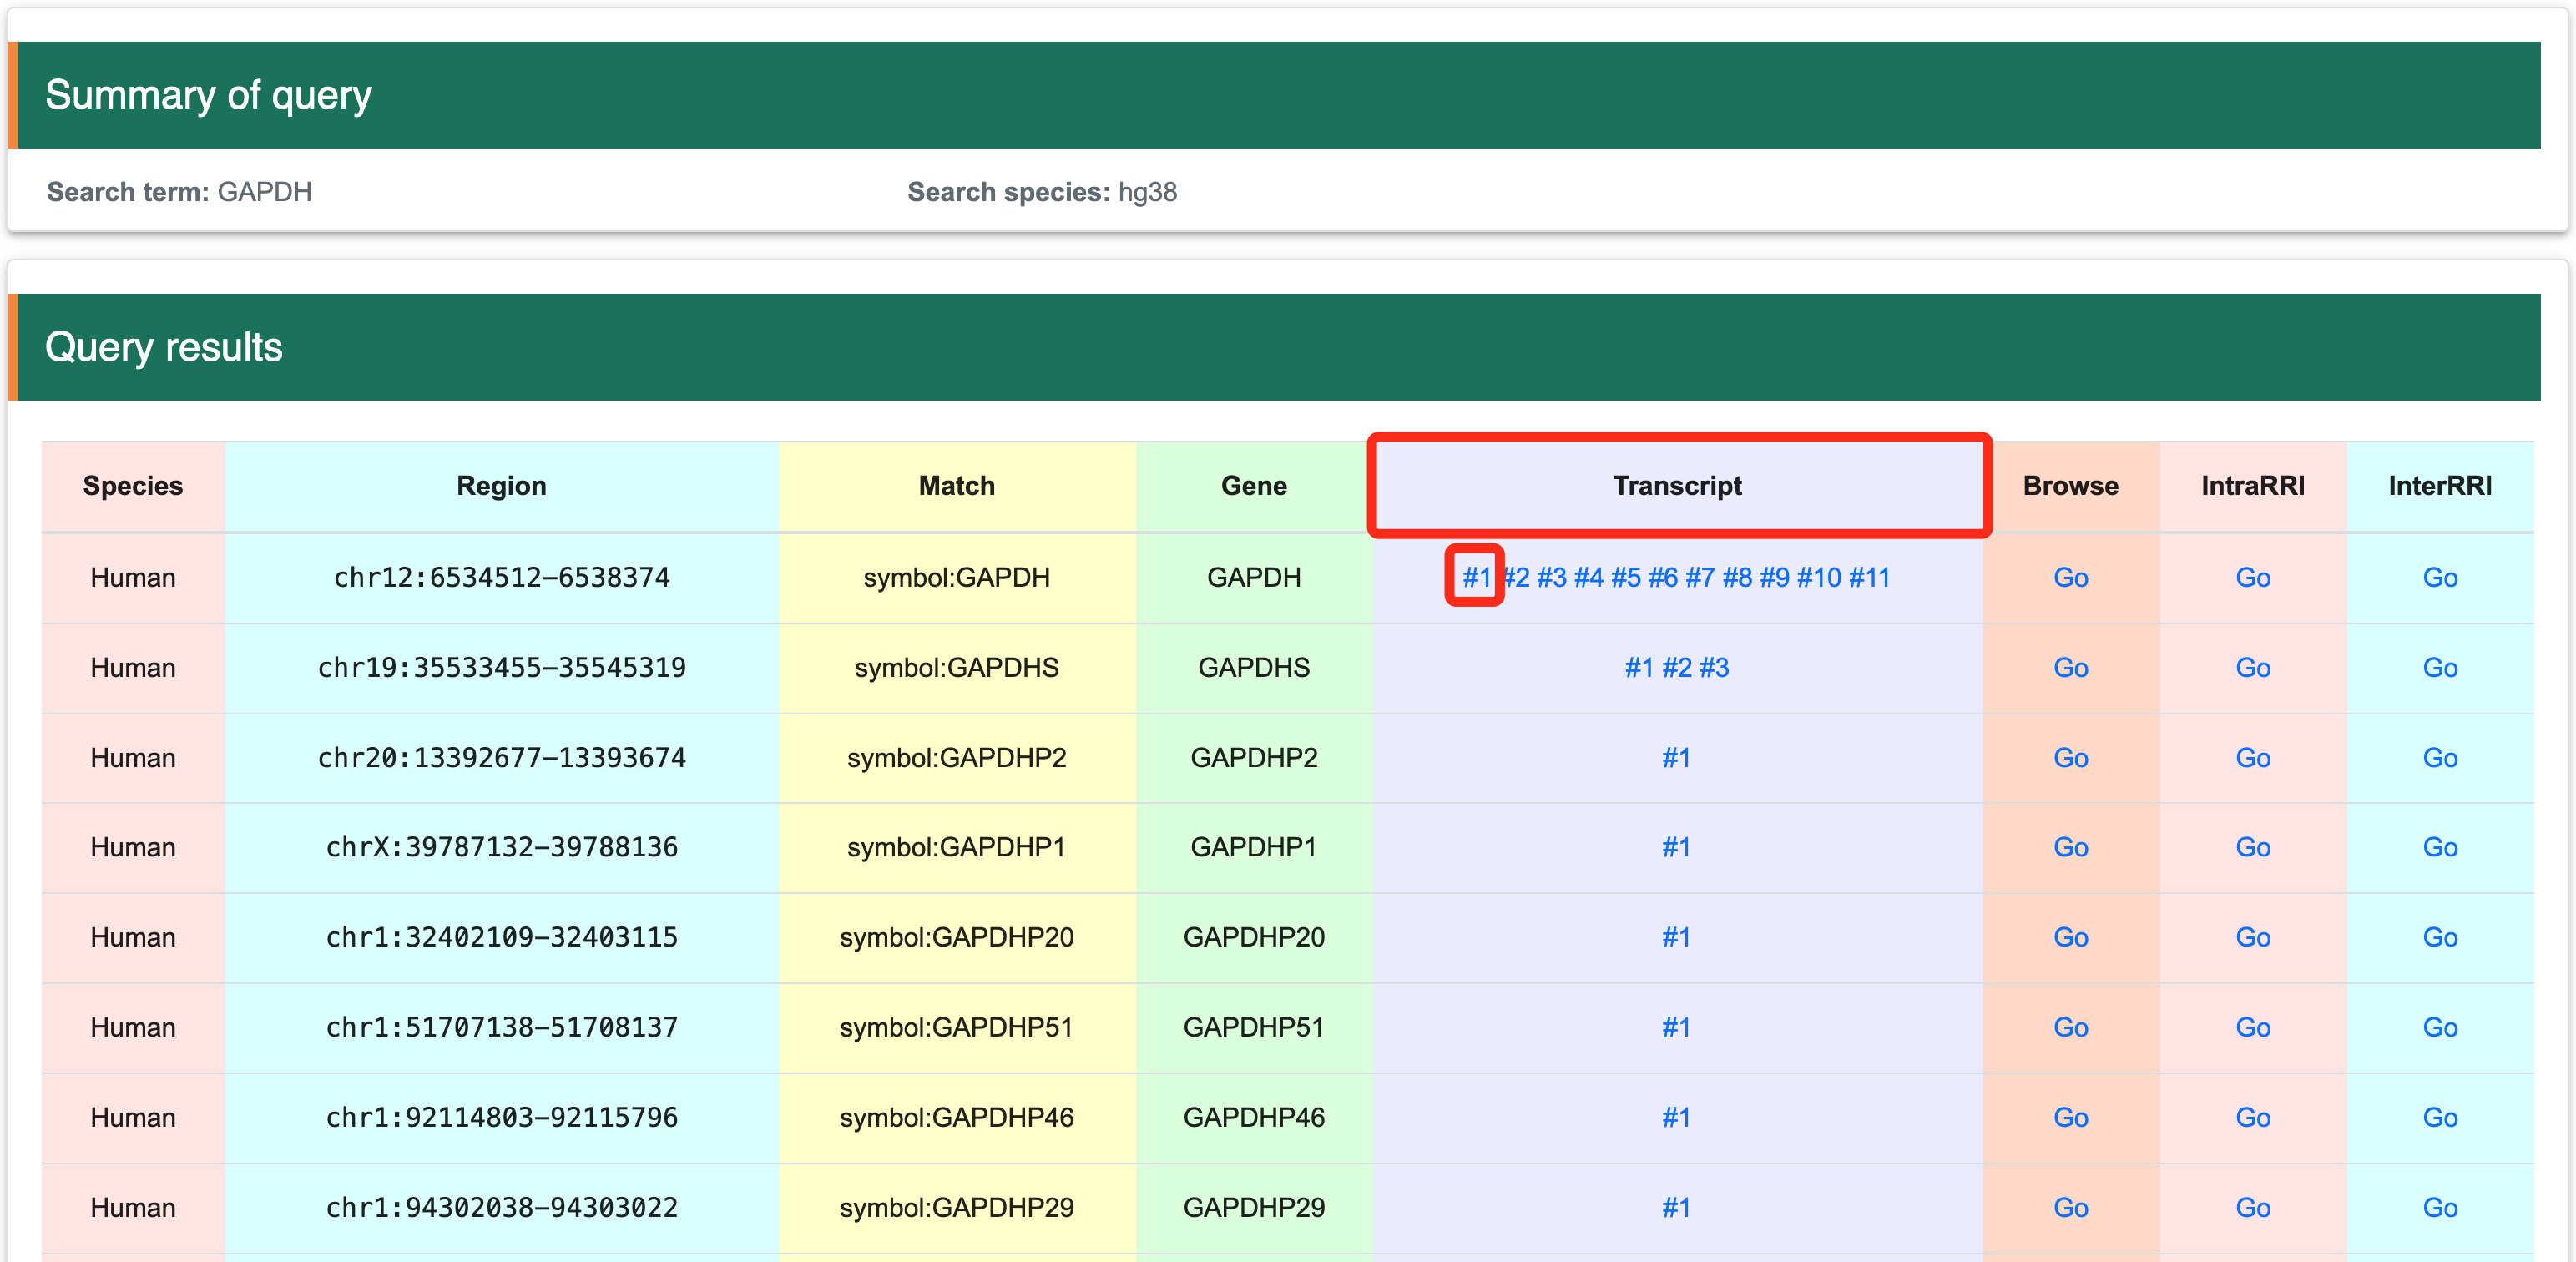
Once the interested gene has been identified using the three methods described above, you will be directed to the search results page. This page lists the names of all matching genes and provides detailed information for each gene. The information is organized into columns as follows: the first column contains species information, the second column provides genomic coordinates, the third column shows matches, the fourth column lists gene names, the fifth column includes all transcripts corresponding to the gene, the sixth column allows JBrowser navigation, the seventh column offers intramolecular RRI navigation, and the eighth column offers intermolecular RRI navigation. Users can visualize data in the genome or transcript by clicking the ‘Go’ button or on any transcript. To access the corresponding tutorial, users can follow the provided link:
2.1 View probing data at the transcript level
2.2 View probing data at the genomic level
2.3 View intermolecular RNA-RNA interactions
2.4 View intramolecular RNA-RNA interactions
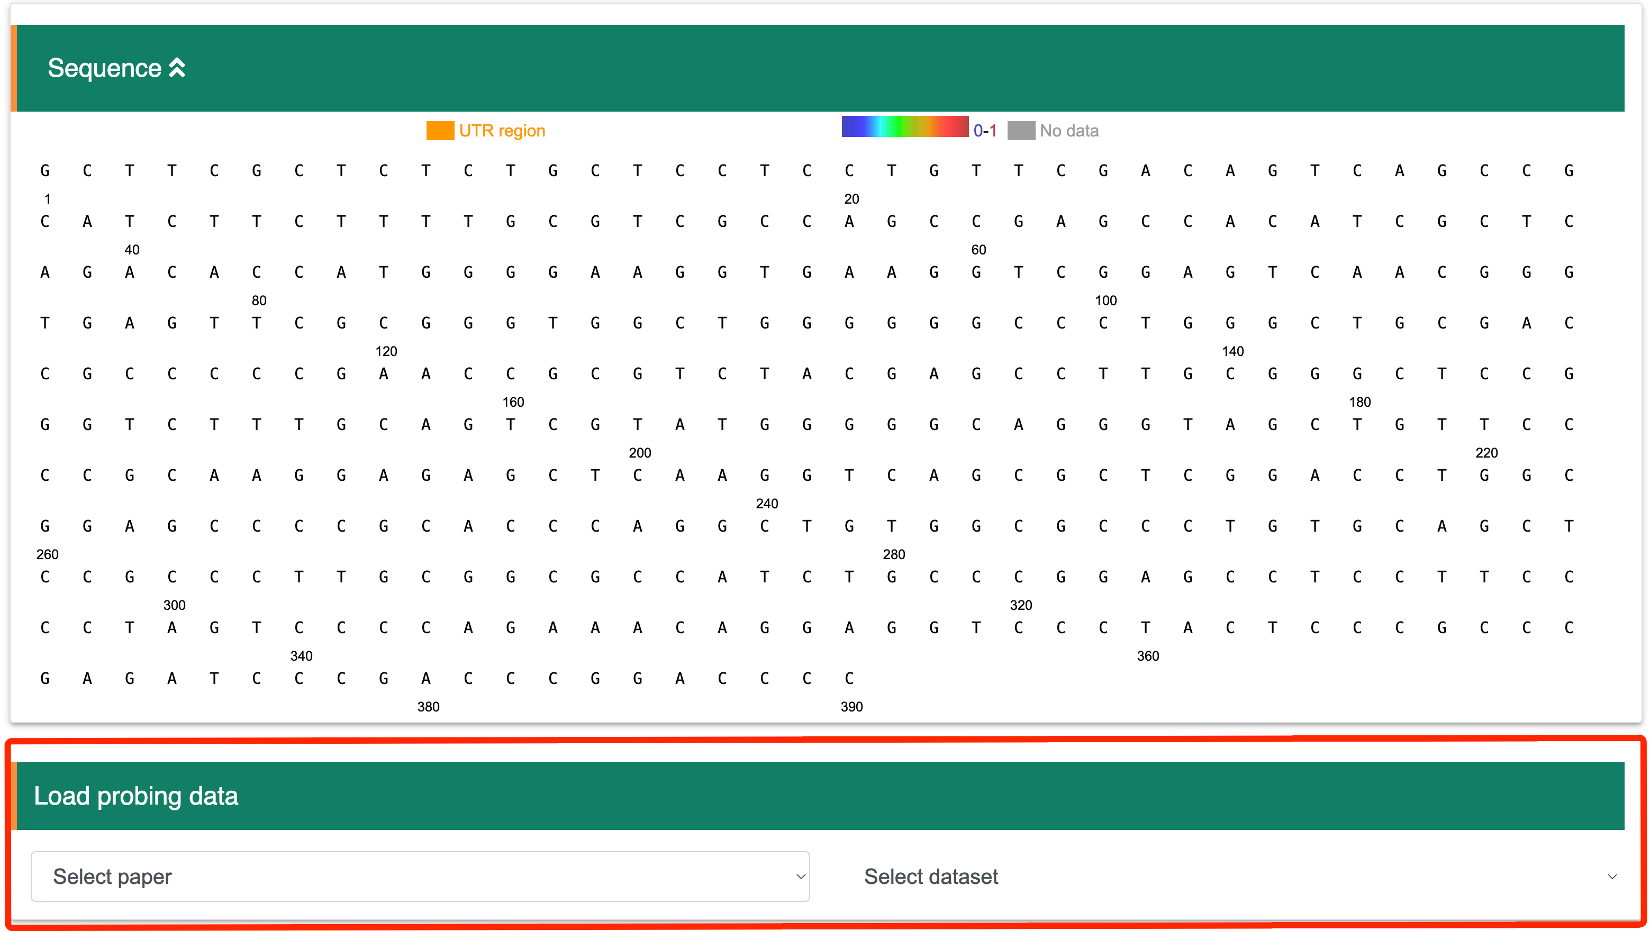
2.1 View at the transcript levelStep 1:After selecting an interested gene, the page will display a matched list. Users can then choose their interested transcript to view detailed information.
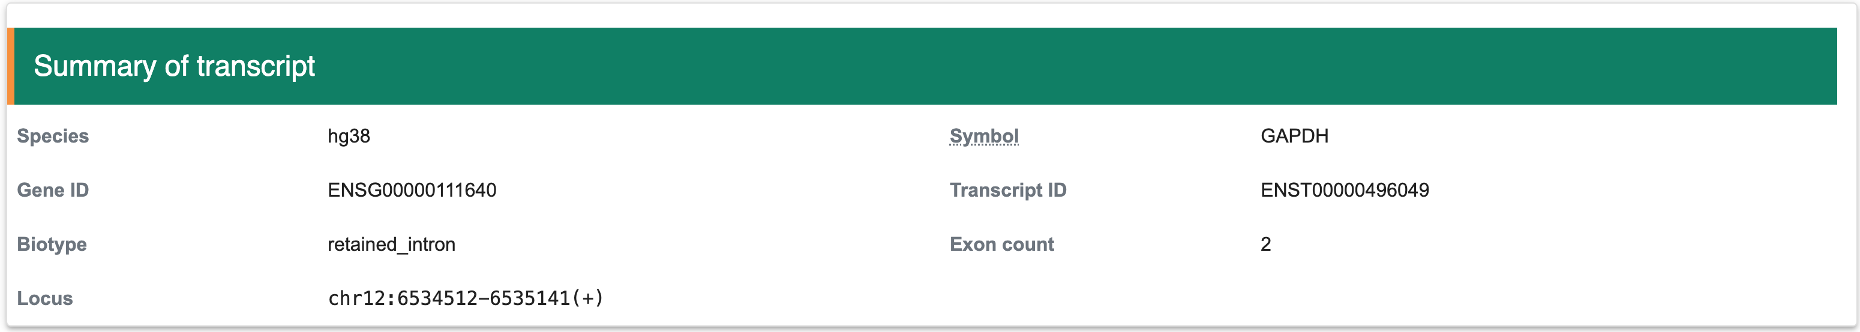
Step 2:The summary of interested transcript will be show in the table below
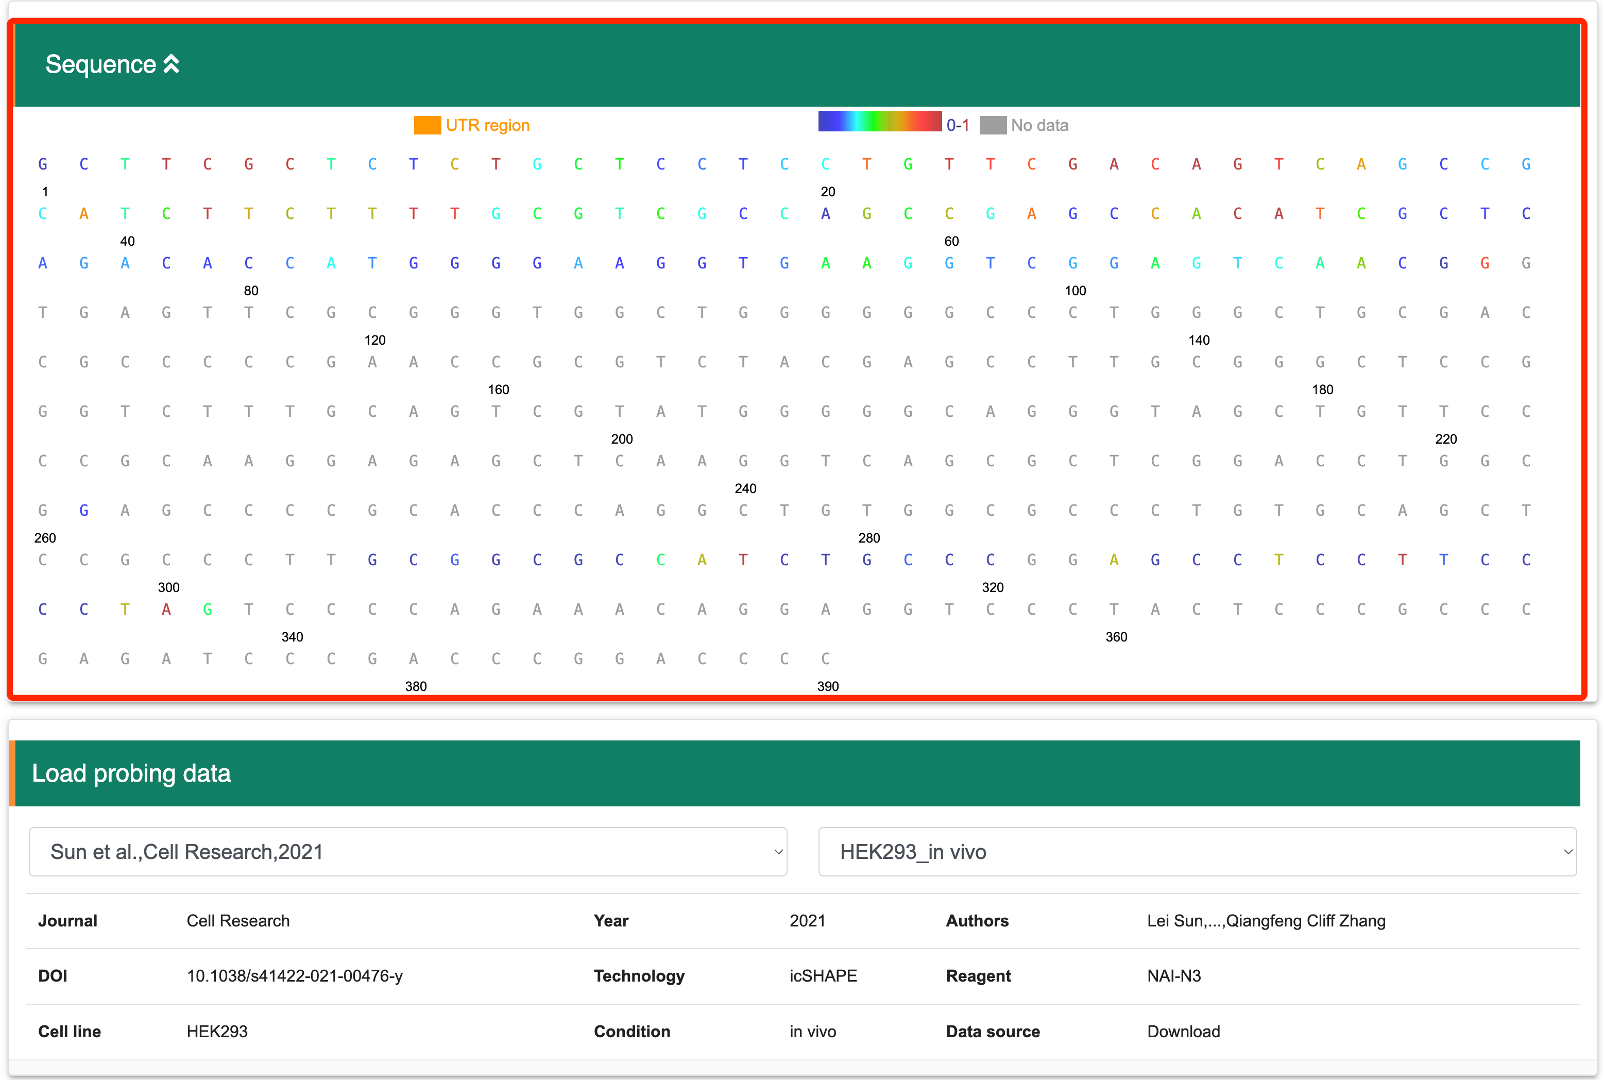
Step 3: Once the transcript of interest has been located, the user first needs to load the corresponding structure probing data. The user can select the relevant article and dataset sequentially from the drop-down menu provided by RASP v2.0 to visualize the transcript's corresponding structure probing data and the statistical information.
Step 4: After selecting the structure probing data stored in RASP v2.0, the bases corresponding to this transcript will be highlighted in different colors, with each color representing different structure scores, and black indicating null values.
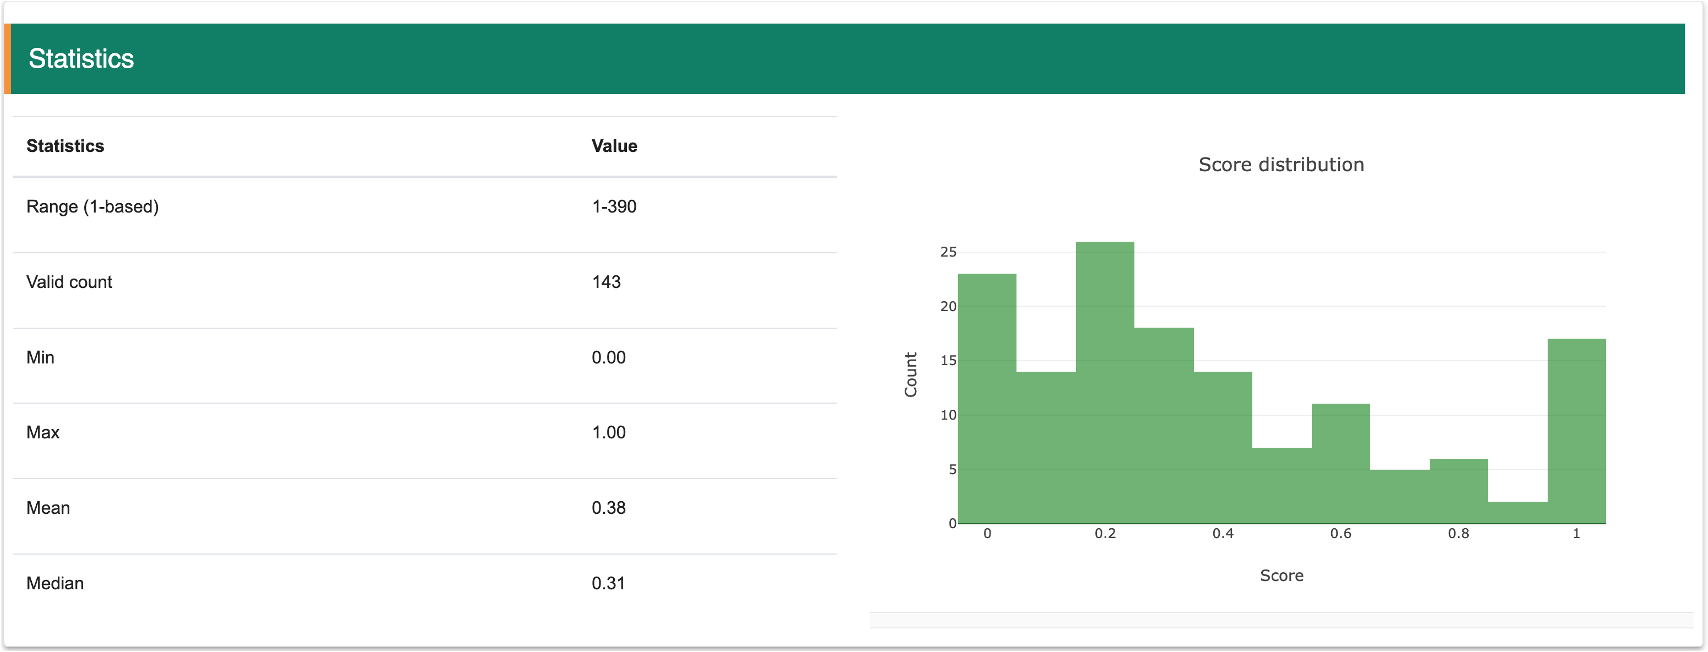
Step 5: The statsitic information of structure scores for this transcript will show in the figure.
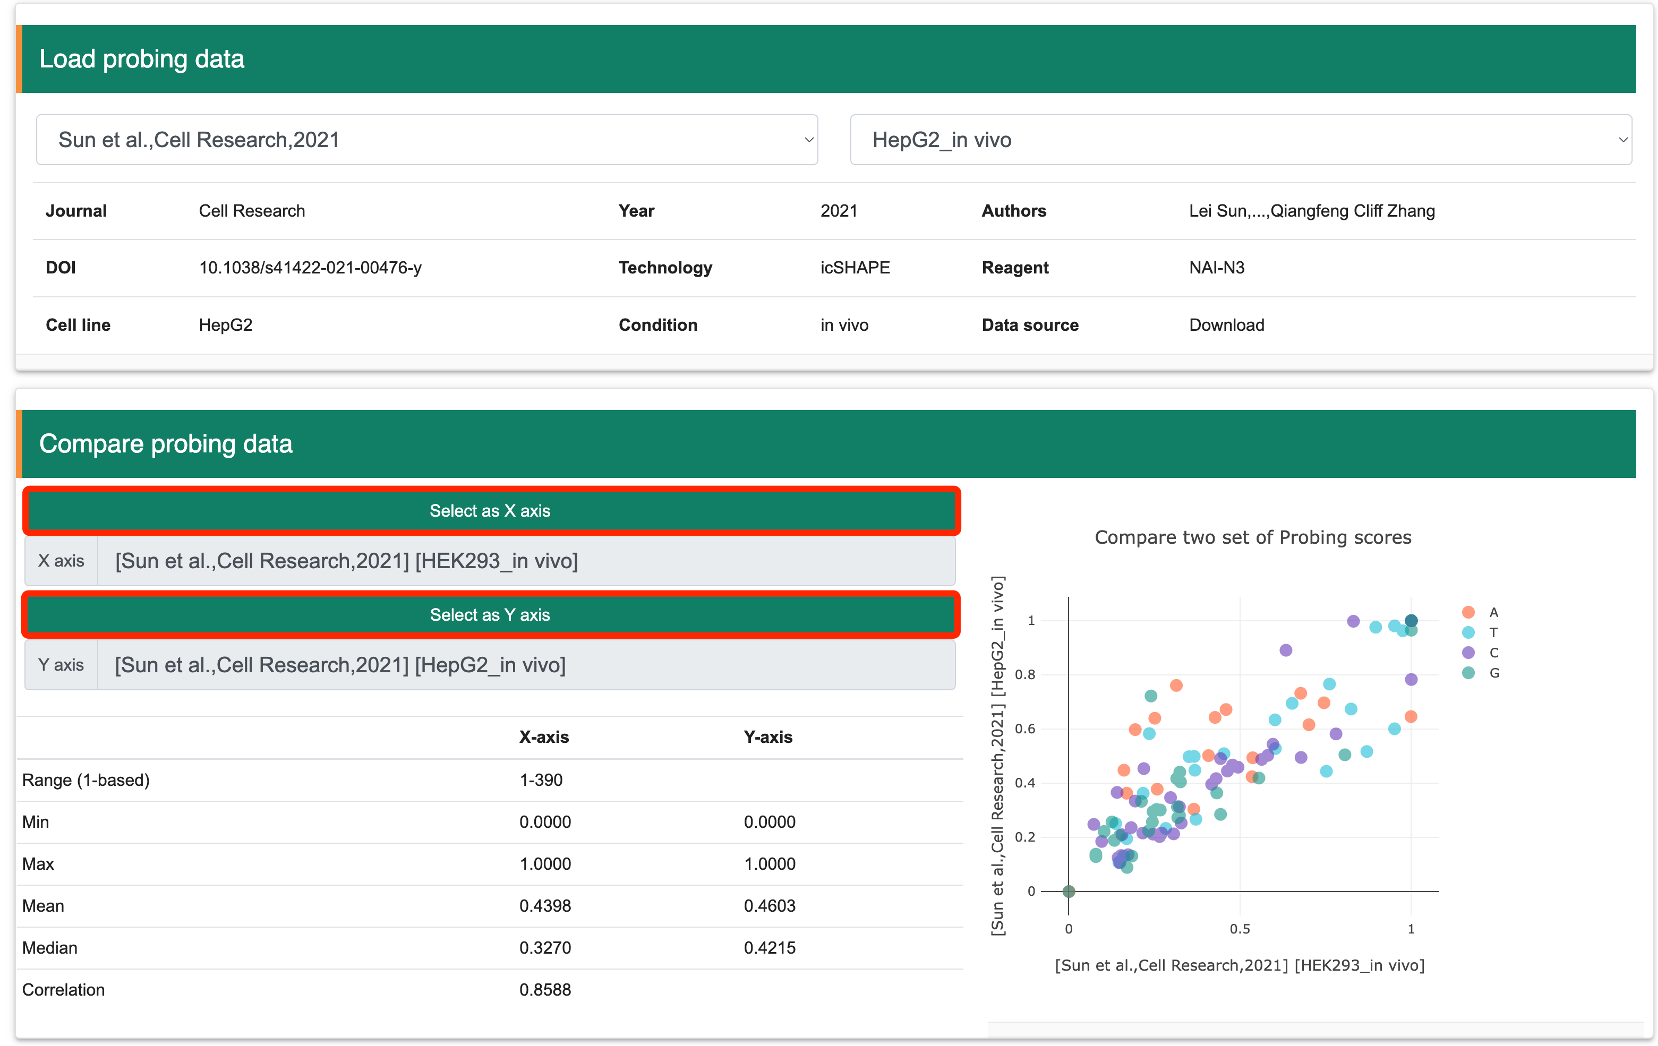
Step 6: RASP v2.0 provides a comparison function for different RNA structure probing datasets. Specifically, users need to first load the dataset of interest and click “Select as X axis” to add it to the comparison candidate list. Next, the user selects the second dataset of interest and clicks “Select as Y axis.” RASP v2.0 will then calculate the correlation of SHAPE scores between the two datasets.
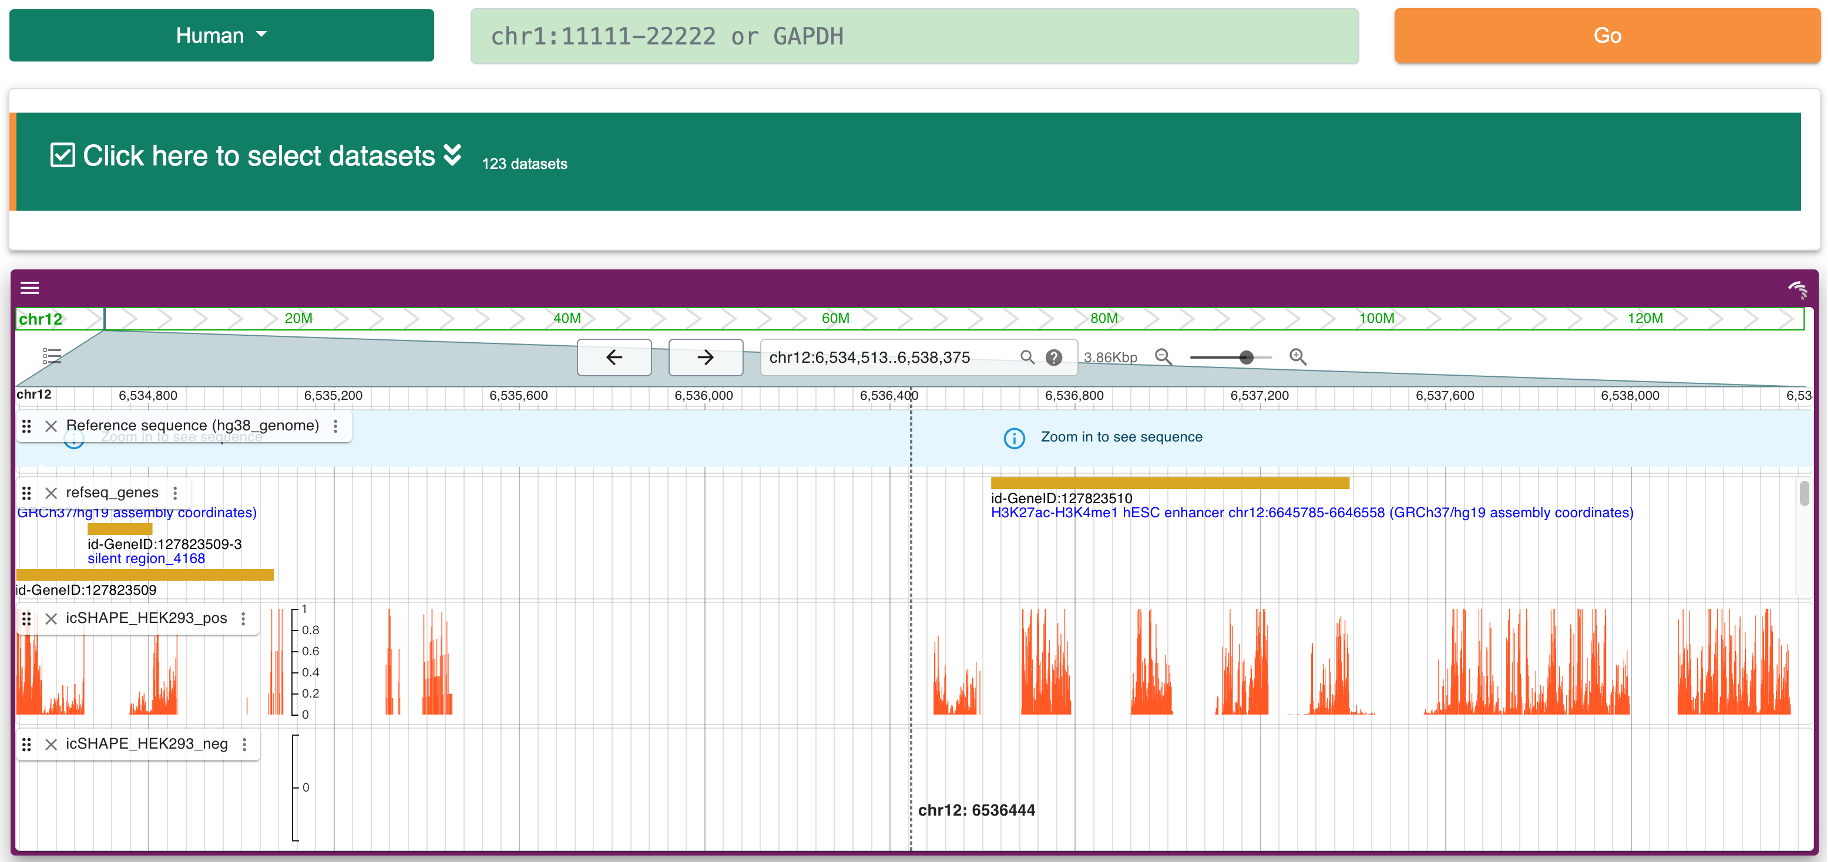
2.2 View at the genomic levelStep 1:After selecting "Browse," the page will display the whole track of structure scores corresponding to the structure probing data.
Step 2: Users can view the whole structure scores track for the intersted transcript based on Jbrowser2.
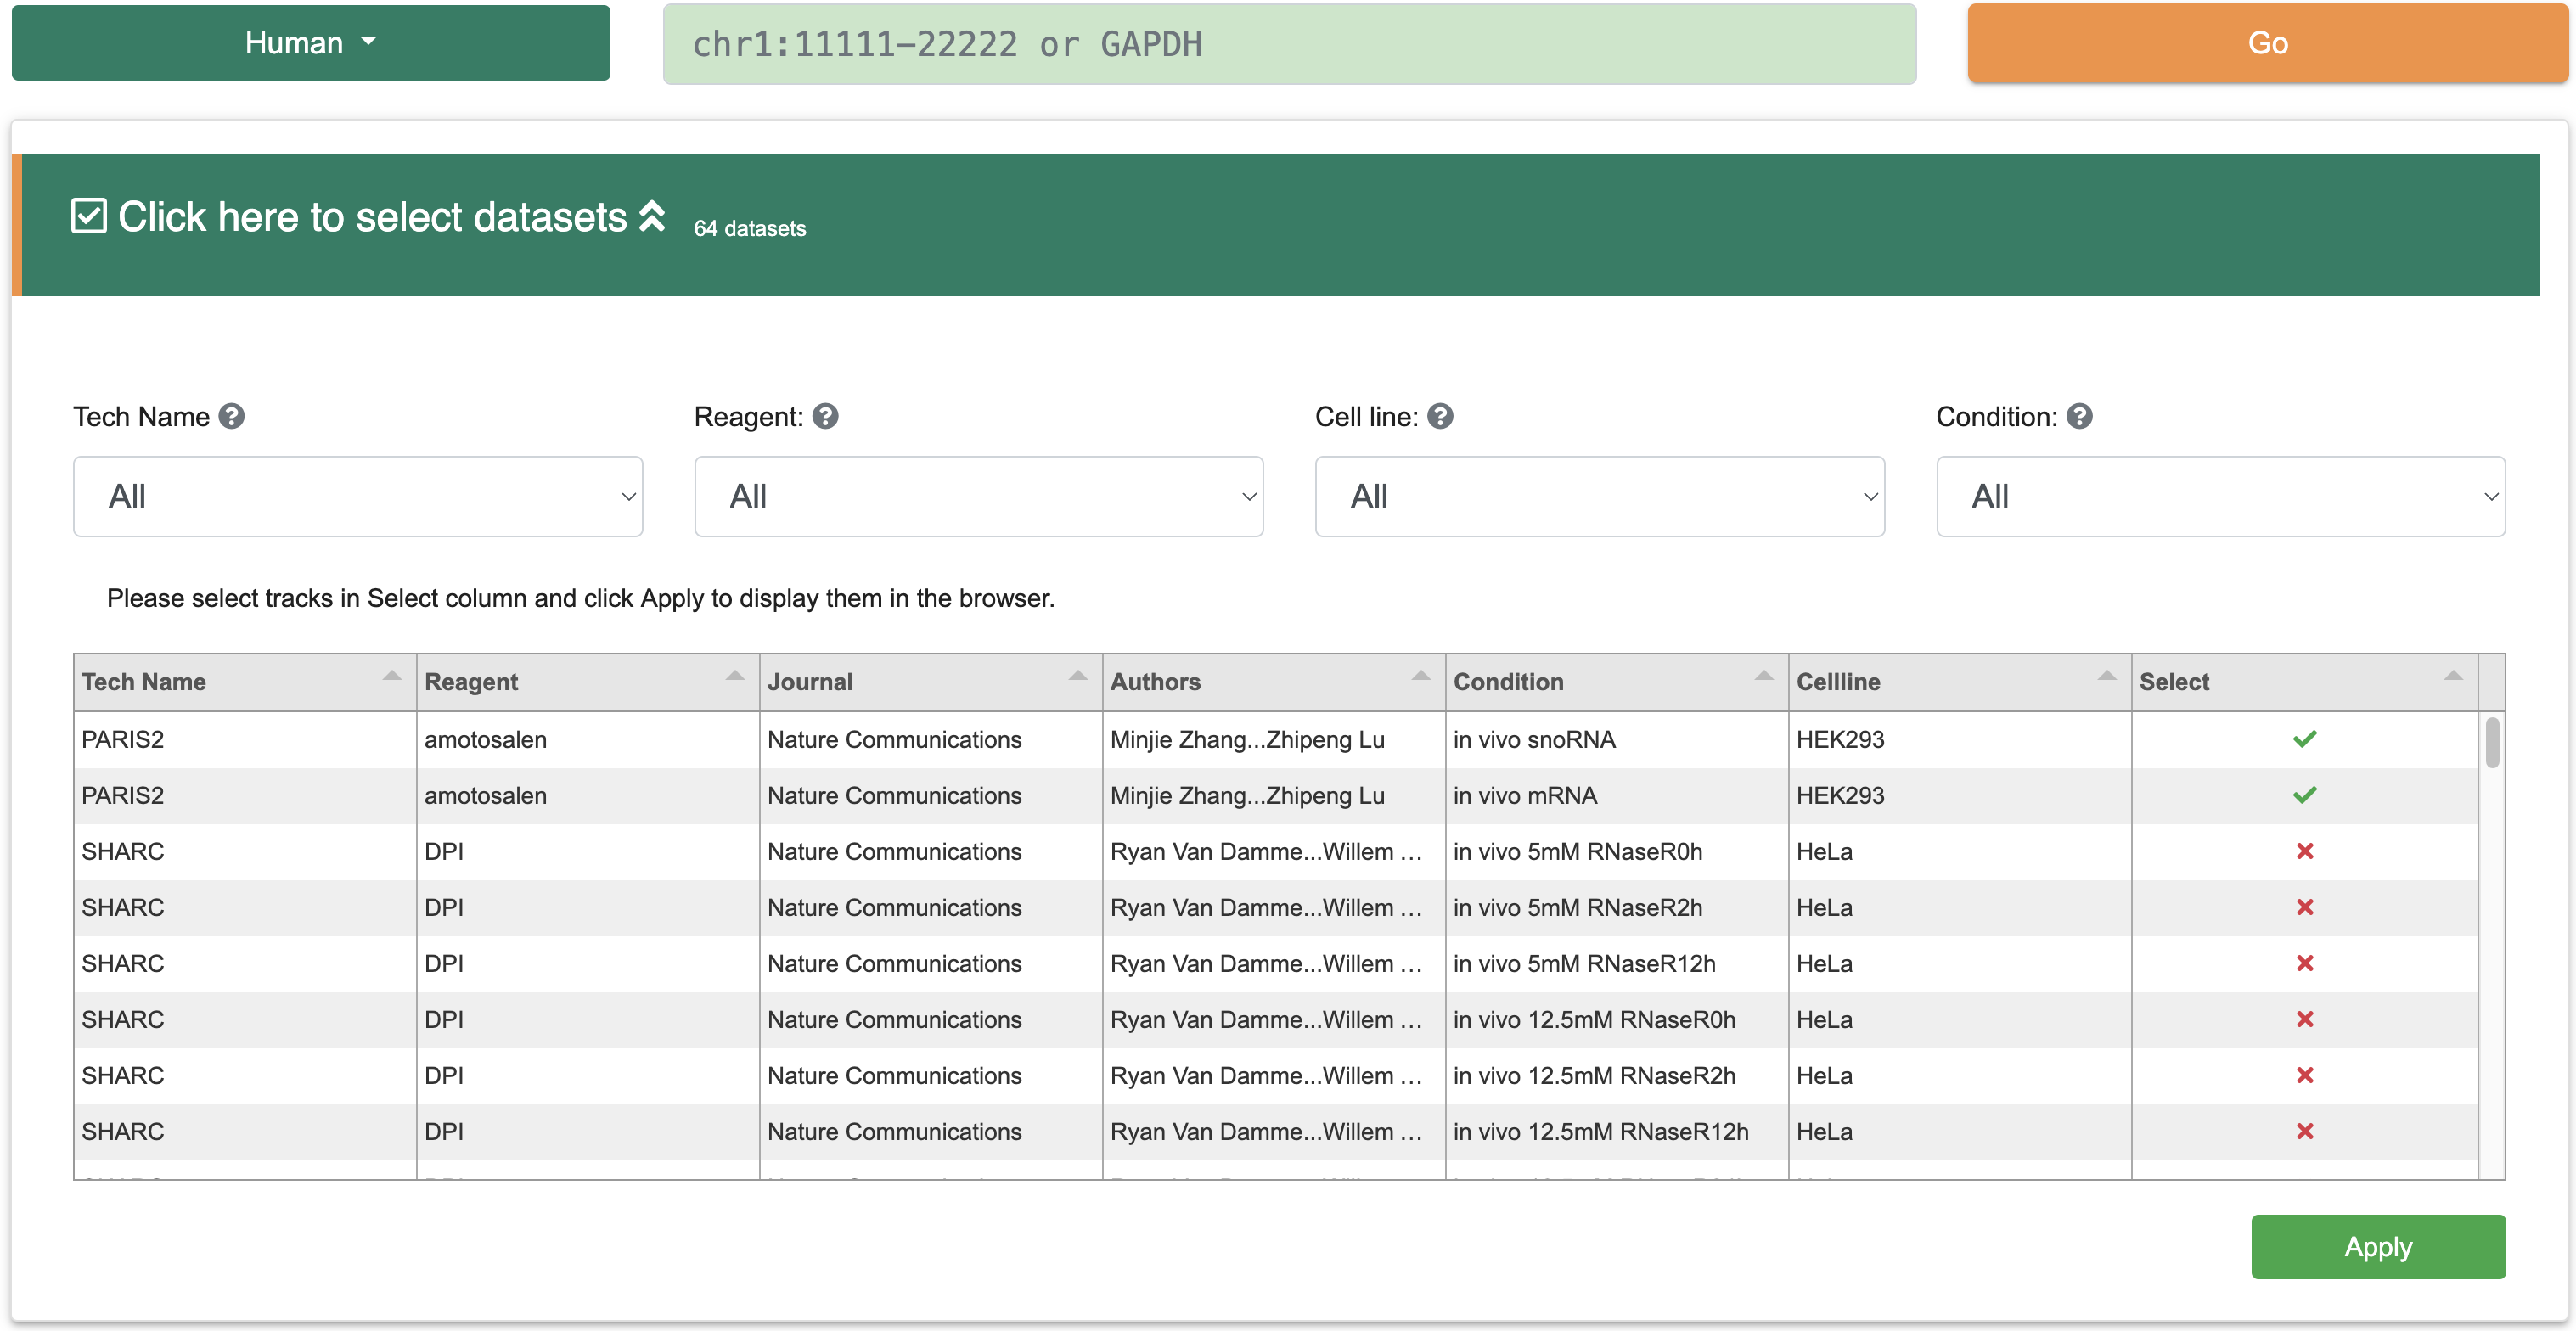
Step 3:This interface includes a filter that allows users to select different structure probing datasets. The filter provides detailed information about the structure probing data, such as experimental techniques, probes, journals, conditions, and cell lines. Users can select one or more files from the "Select" column, and the results will be displayed in JBrowse2 below.
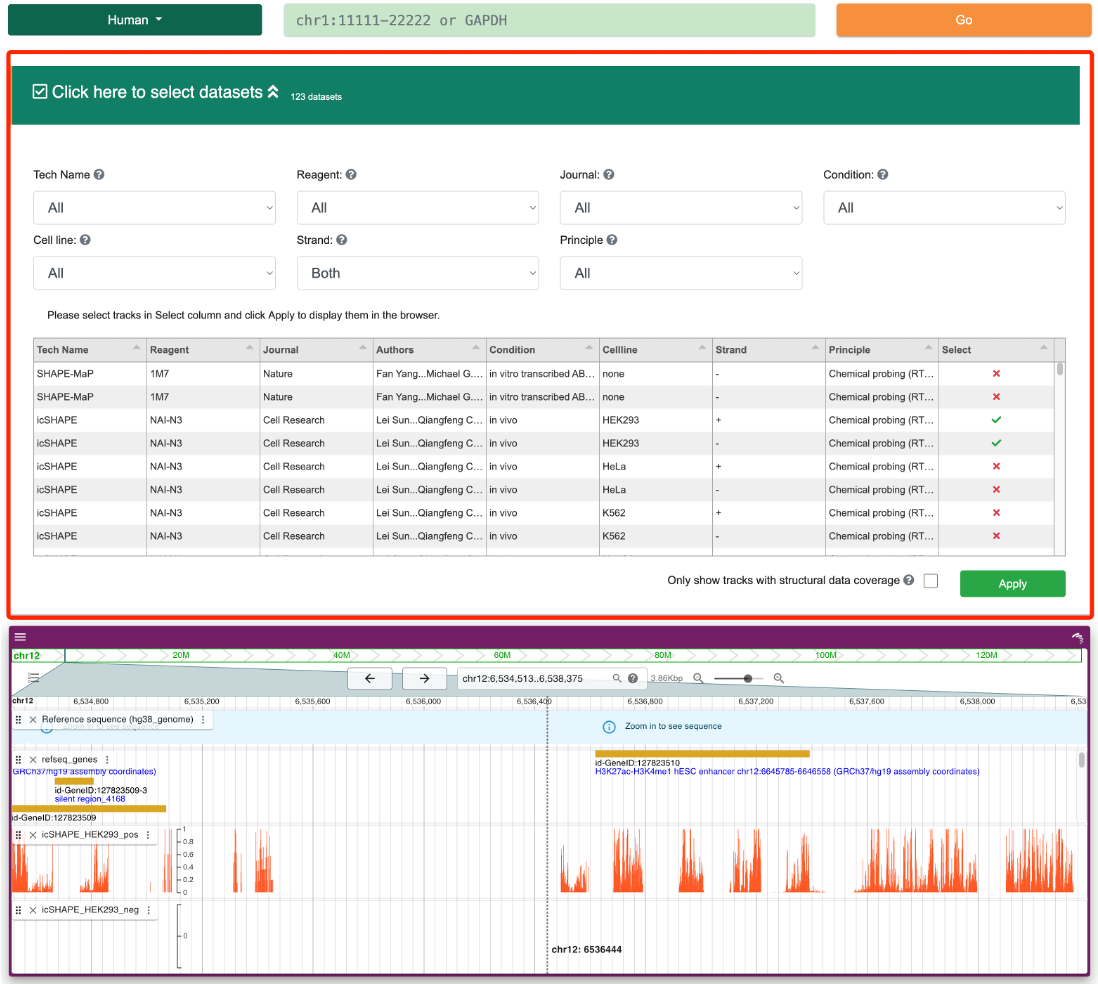
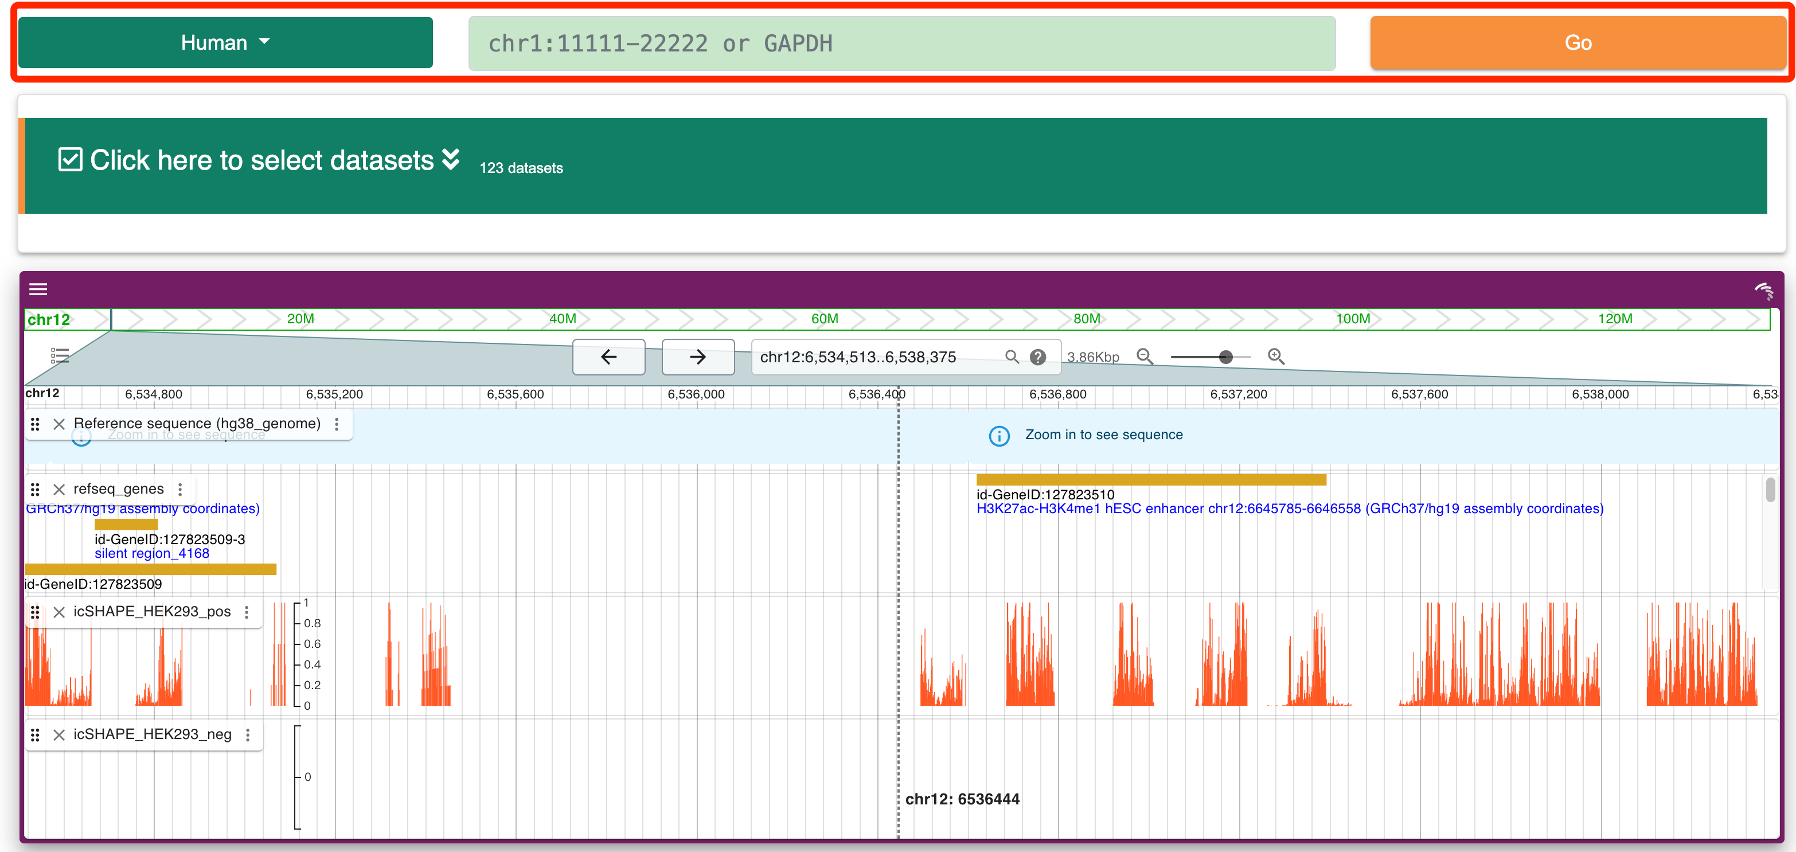
Step 4:Users can also directly locate a gene by name on the browse page, and JBrowse2 will automatically navigate to the corresponding gene location with selected structure probing datasets. Additionally, users can click on the “Imputation” column to choose whether to display missing structure values. Specifically, RASP v2.0 utilizes the StructureImpute tool to predict these missing values, thereby enhancing the data quality of low-coverage transcripts.
2.3 View Intermolecular RNA-RNA interaction
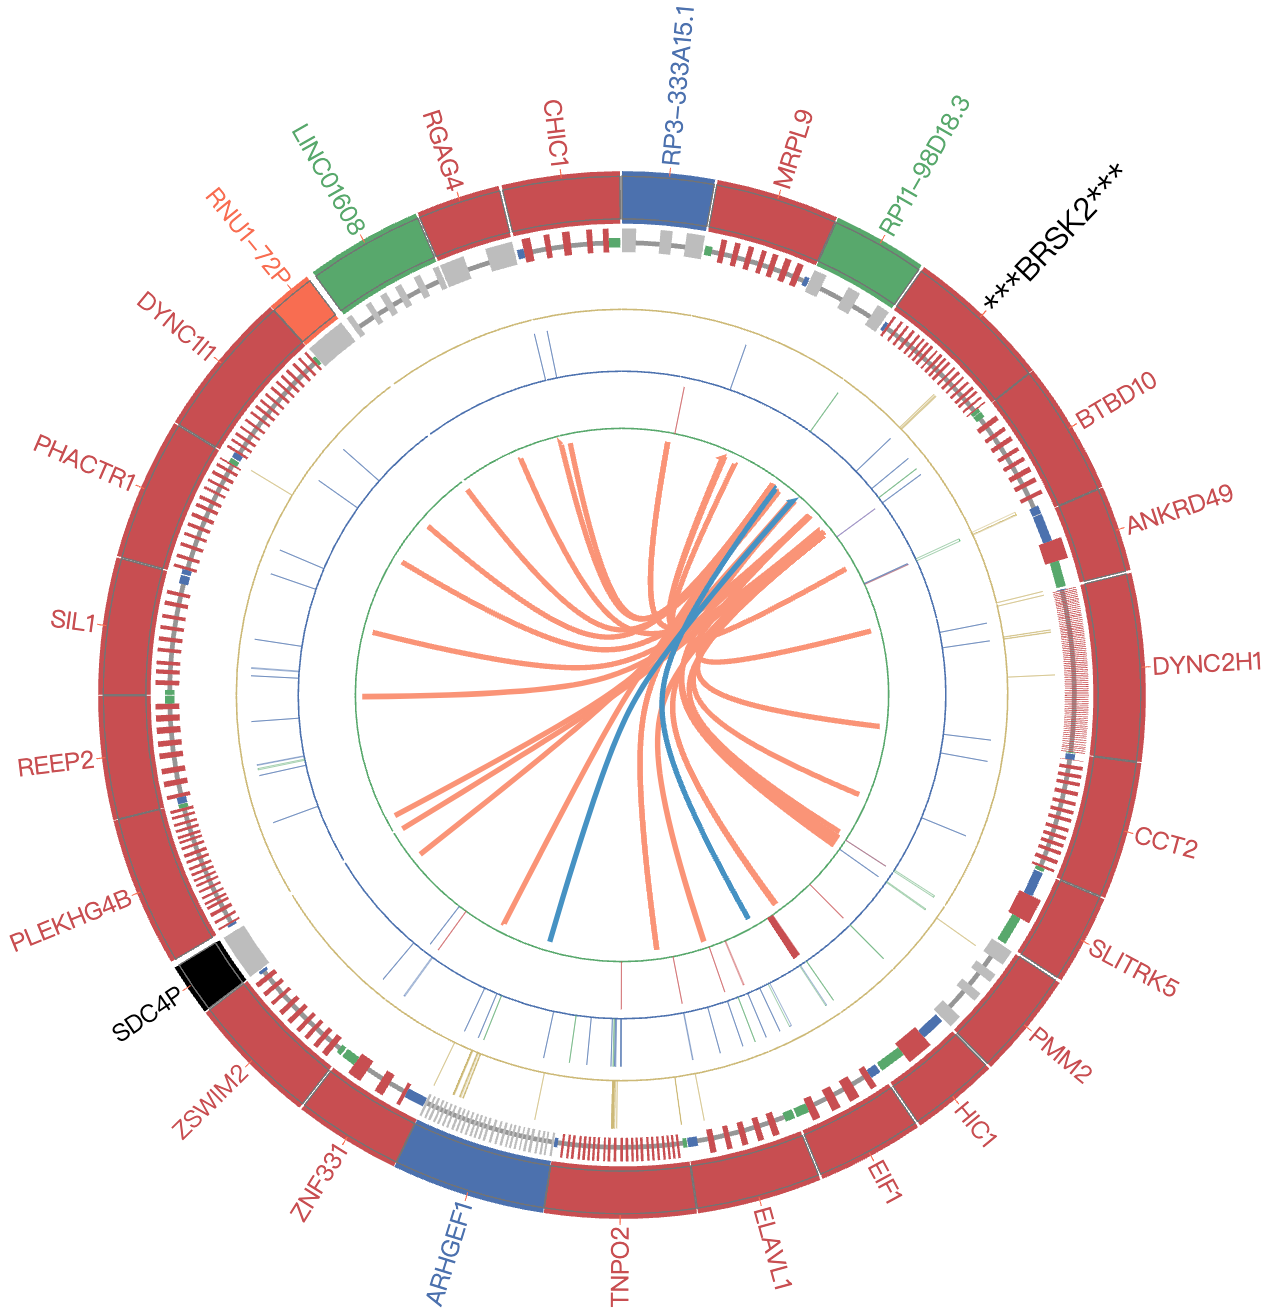
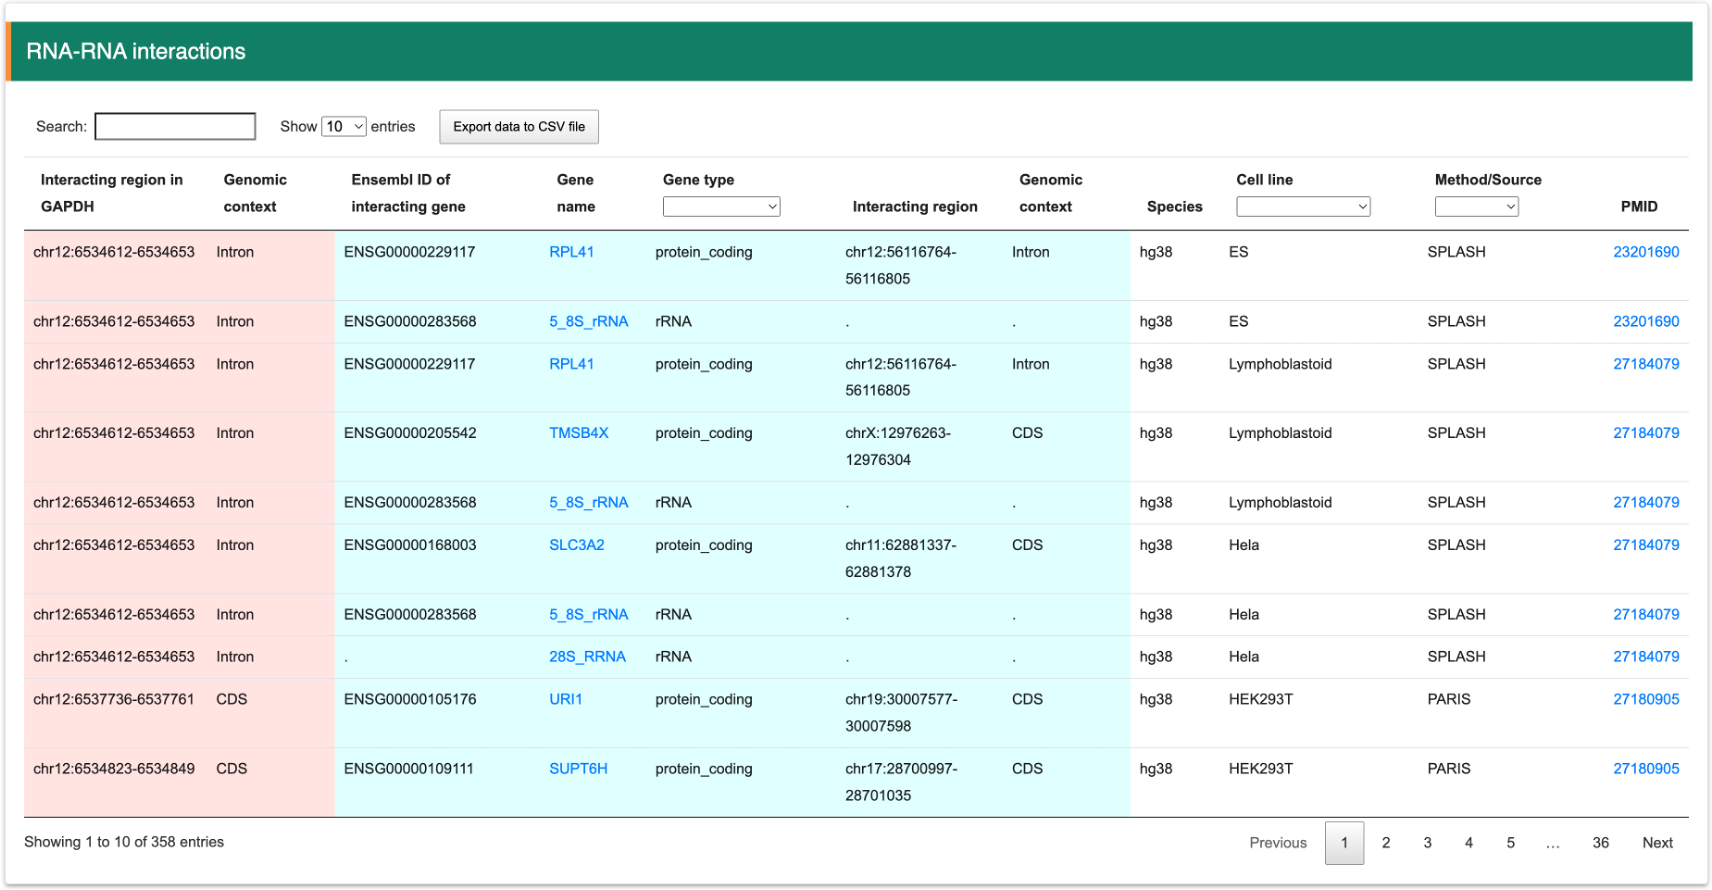
Step 1:After selecting "GO" in "InterRRI" column, the page will display a circus plot corresponding to the structure probing data, which includes: 1) a summary of the transcript of interest, 2) a circus plot of intermolecular RRI, and 3) a table of RRI data. Users can view the entire distribution of RRI at the genetic level, and filter the results by gene name in the table.
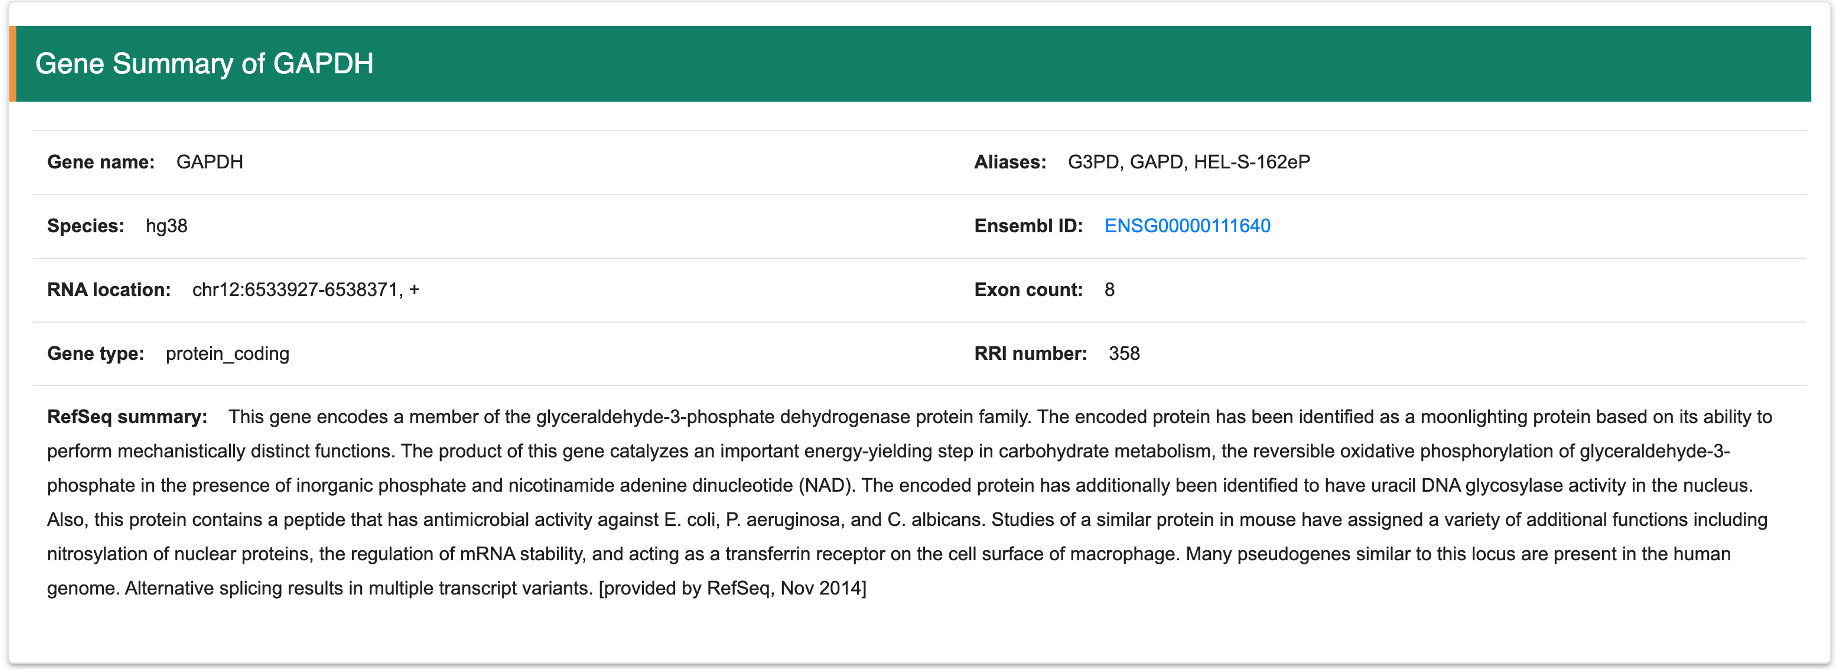
Step 2:This table provides detail information of intersted gene and RefSeq information.
Step 3:The Circos plot will show the intermolecular RNA-RNA interaction directly.
Step 4:User can filter the intersted gene from results table quickly.
2.4 View Inramolecular RNA-RNA interaction
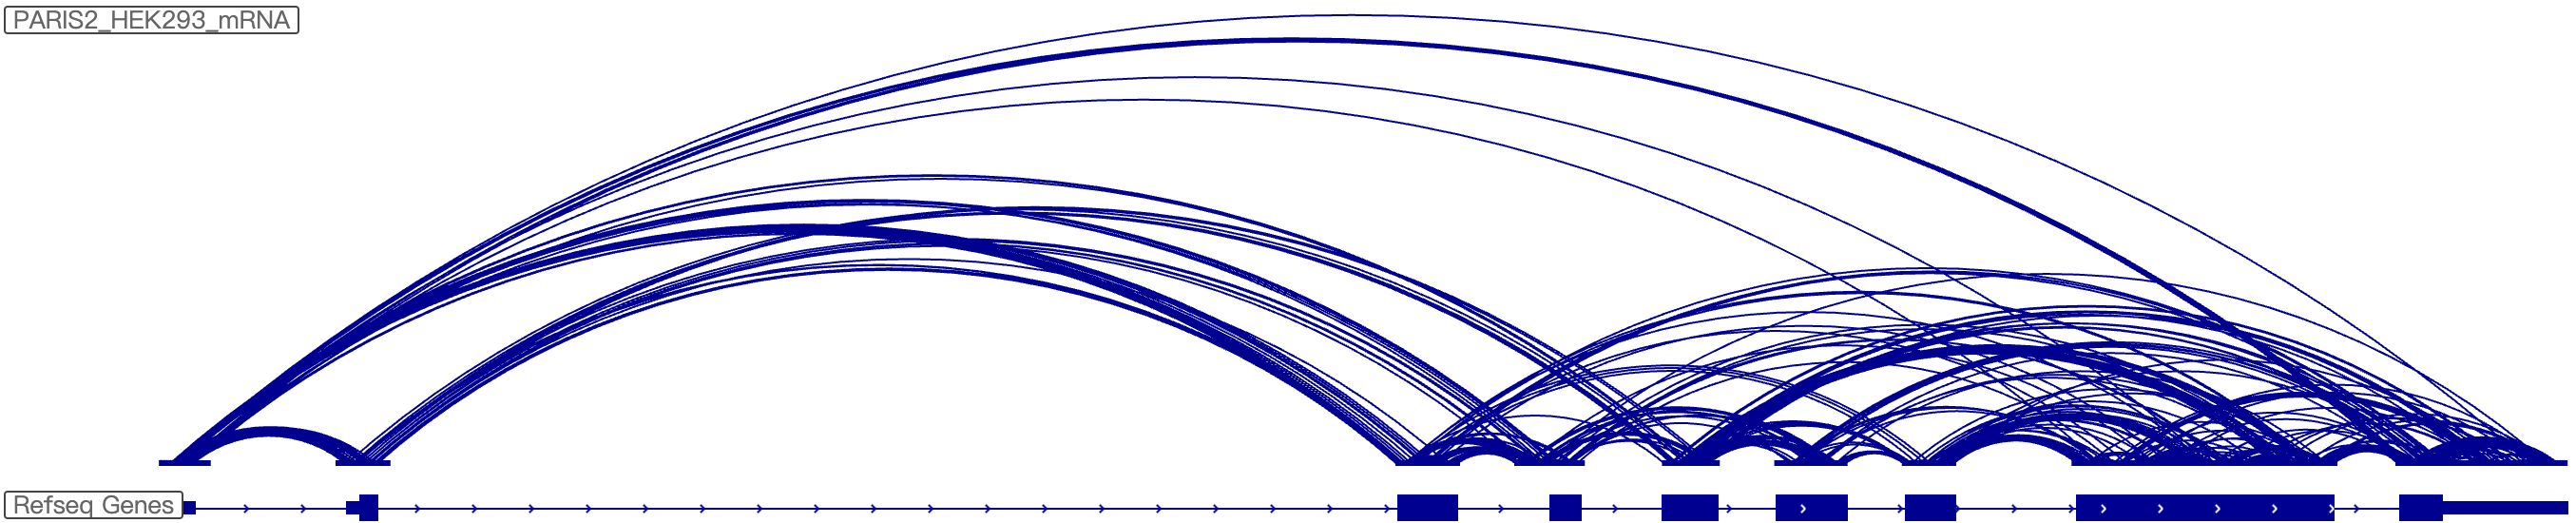
Step 1:After clicking "GO" in the “IntraRRI” column, the page will display the interaction for the same RNA molecule corresponding to the structure probing datab based on IGV-web
Step 2:The IGV-web show the Intramolecular RNA-RNA interaction for the intersted gene directly
Step 3:User can selected the intersted gene and dataset with this filter
-
3. How to use analysis module in RASP v2.0
Various advanced analysis modules have been also integrated into RASP v2.0 to assist researchers without bioinformatics expertise for data analysis. In RASP v2.0, we newly added three online analysis modules, including I) missing structure score imputation, II) RNA structure prediction, and III) RBP binding prediction. Users can jump to the corresponding tuturial via the following links:
3.1 Structure score imputation
3.2 Secondary structure prediction
3.3 Tertitary structure prediction
3.4 RBP binding prediction
3.5 Sequence alignment
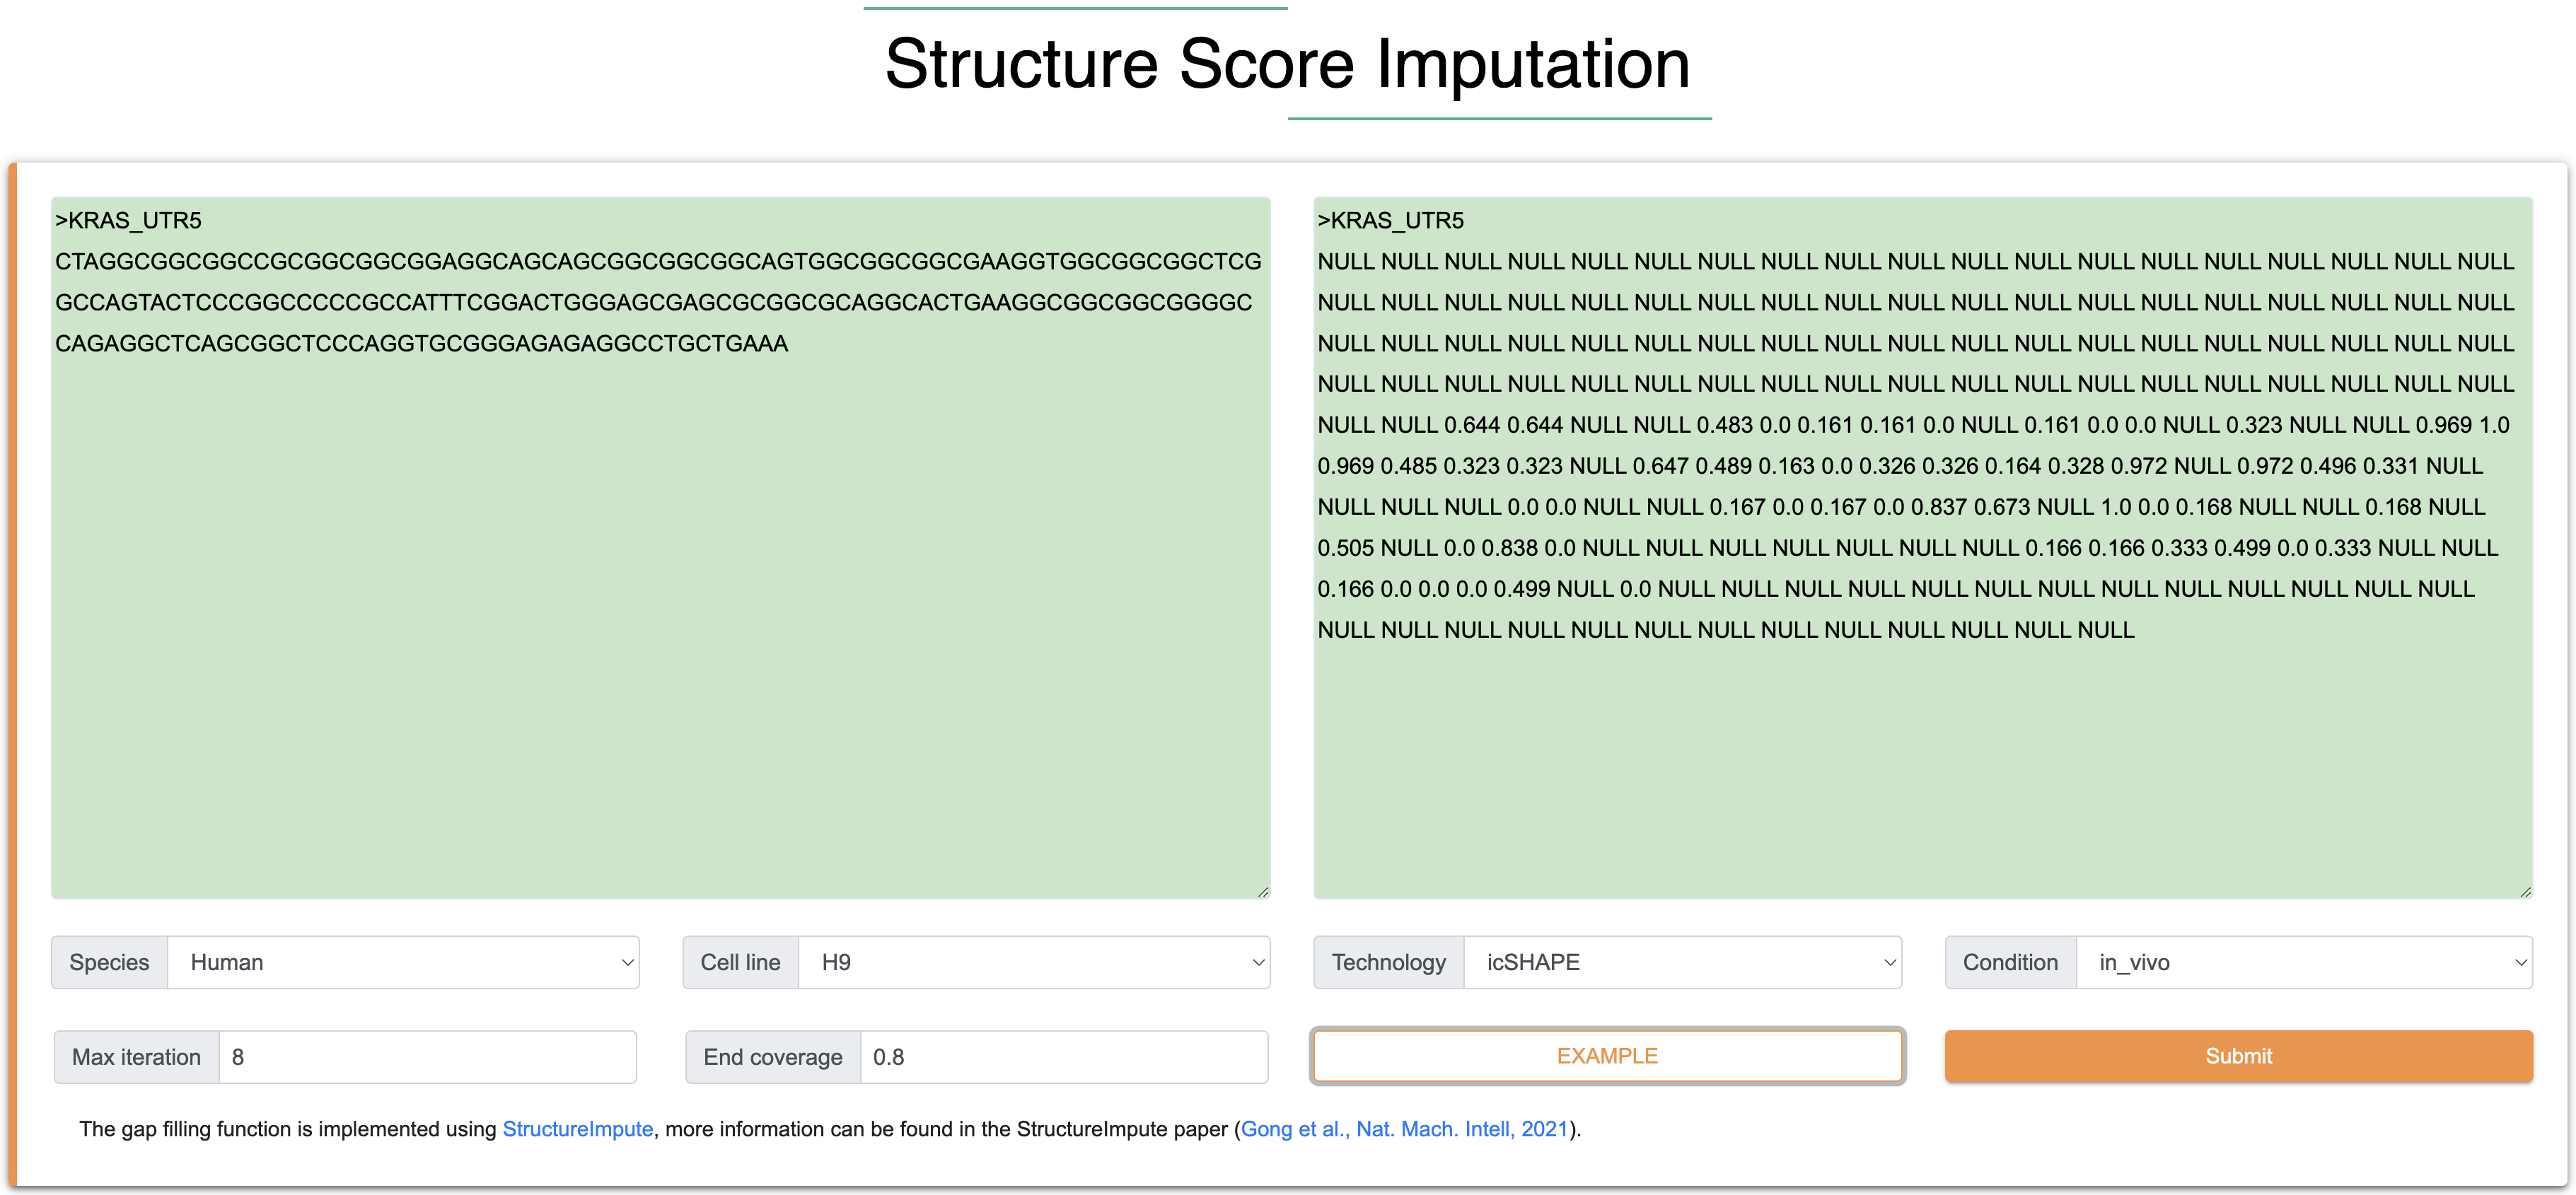
3.1 Structure score imputationConsidering the RNA structural profiles obtained from certain probing experiments (e.g. icSHAPE, DMS-seq, and SHAPE_Map) usually have missing signals for individual nucleotides, continuous regions of a transcript or even an entire transcript. To further improve the data quality, especially for those transcripts in the dataset with low coverage of shape score, we used our previous deep learning-based model StructureImpute to fill the blank regions.
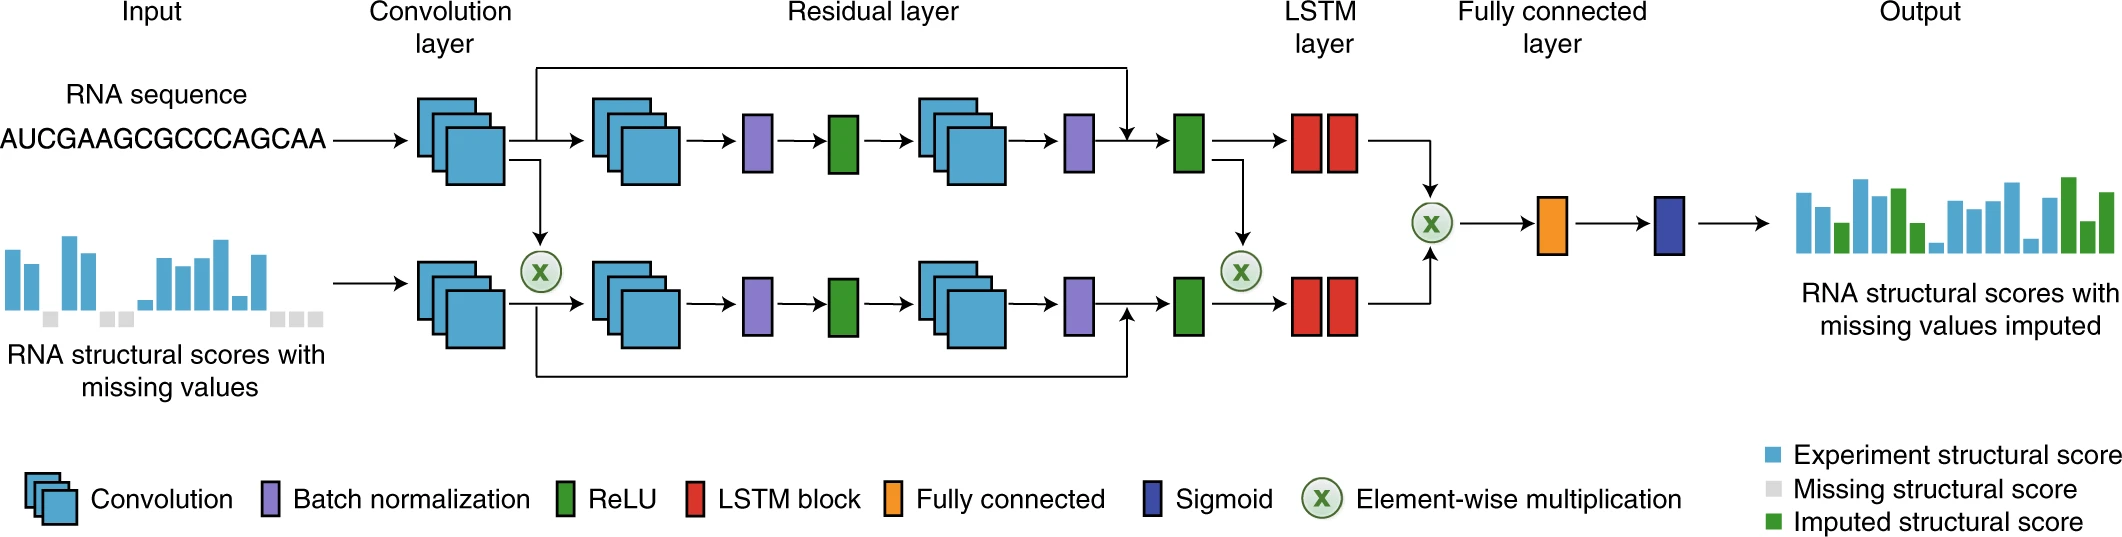
Step 1:The inputs of this module are RNA sequence and sitructure in FASTA format. Among them, the length of each input RNA sequence (A, U, C, G) is at least 100 nt, the total length is limited to 5000 nt, and only the four types of AUCG bases are supported. The length of each input RNA structure follows the same rules with input RNA sequence, and the score ranges from 0 to 1 (-1 is the missing structure signal). 0 indicates that the nucleotide is more likely to be a double-stranded RNA structure, while a score of 1 indicates that the nucleotide is more likely to be a single-stranded RNA structure.
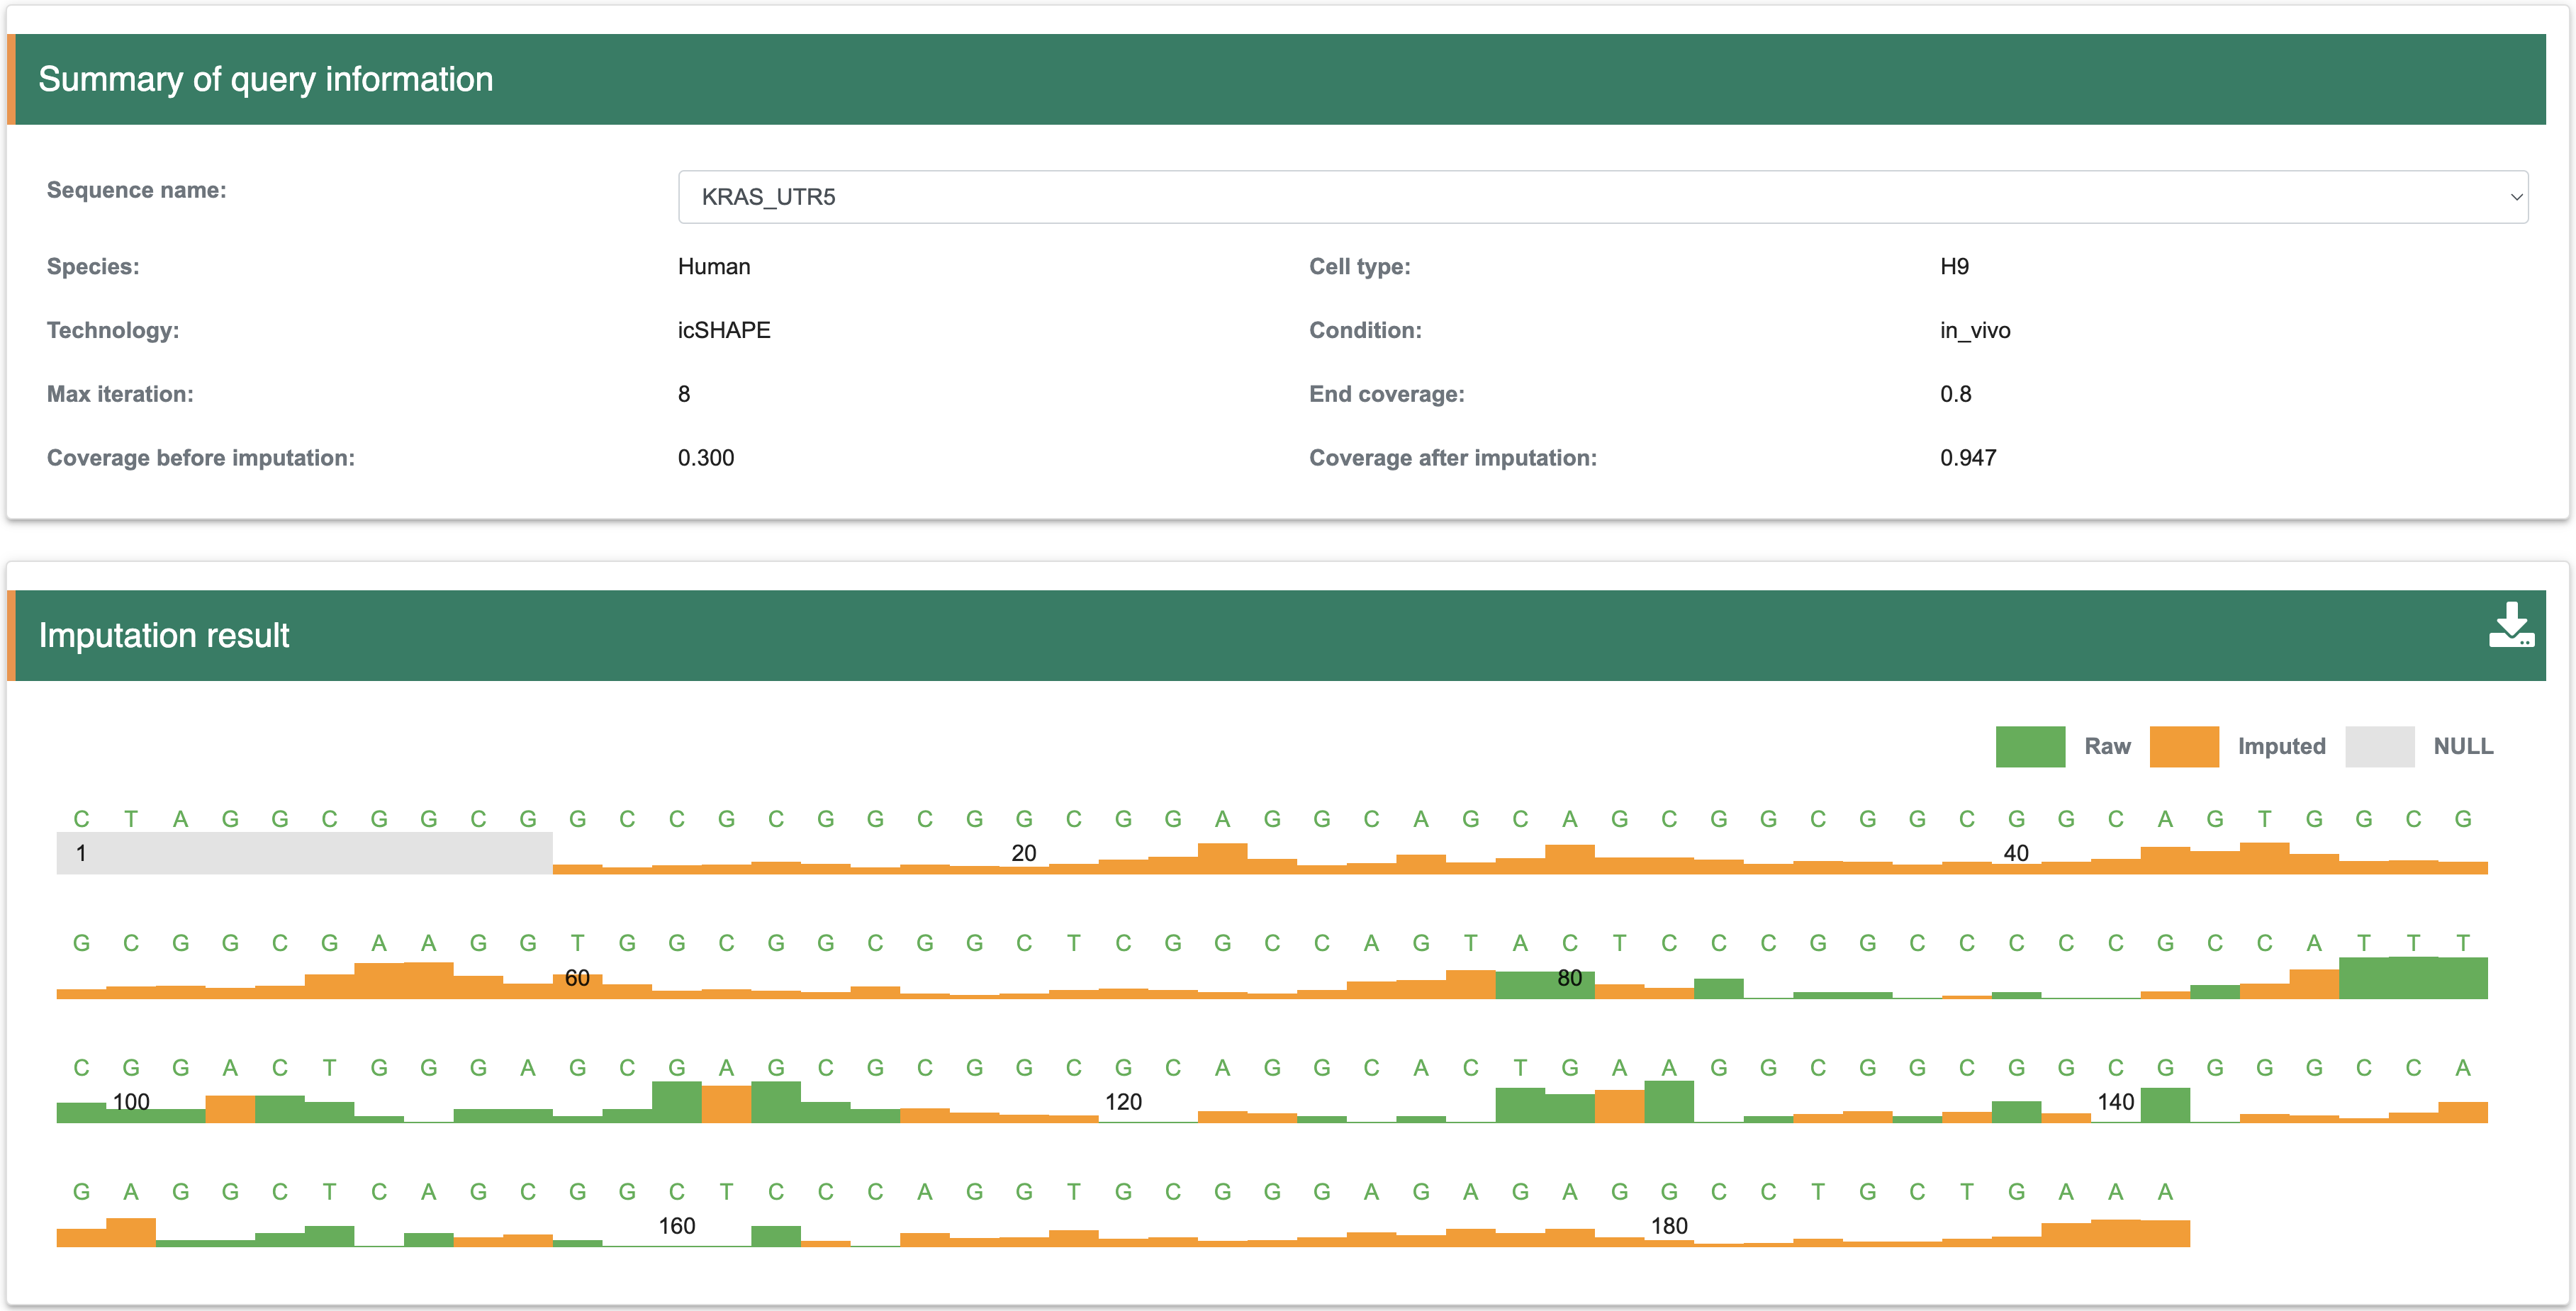
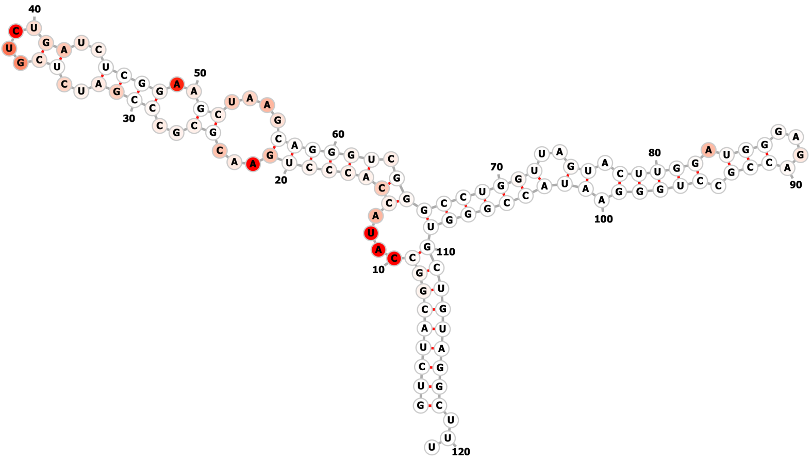
Step 2: The output results contain two parts, the ‘Summary’ shows the detail information for each input sequence, including Species, Cell type, experimental method, Max iteration of model, before/after coverage of imputation. The ‘Result’ shows the track of structure score after imputation. In details, by input the sequence and structure scores (‘Null’ represents missing structure score), the result page will show the track of structure scores after imputation, the green color indicates the raw structure scores and the orange color indicate the imputed structure scores. The users can download the structure scores with .txt format by clicking download icon
3.2 Secondary structure prediction
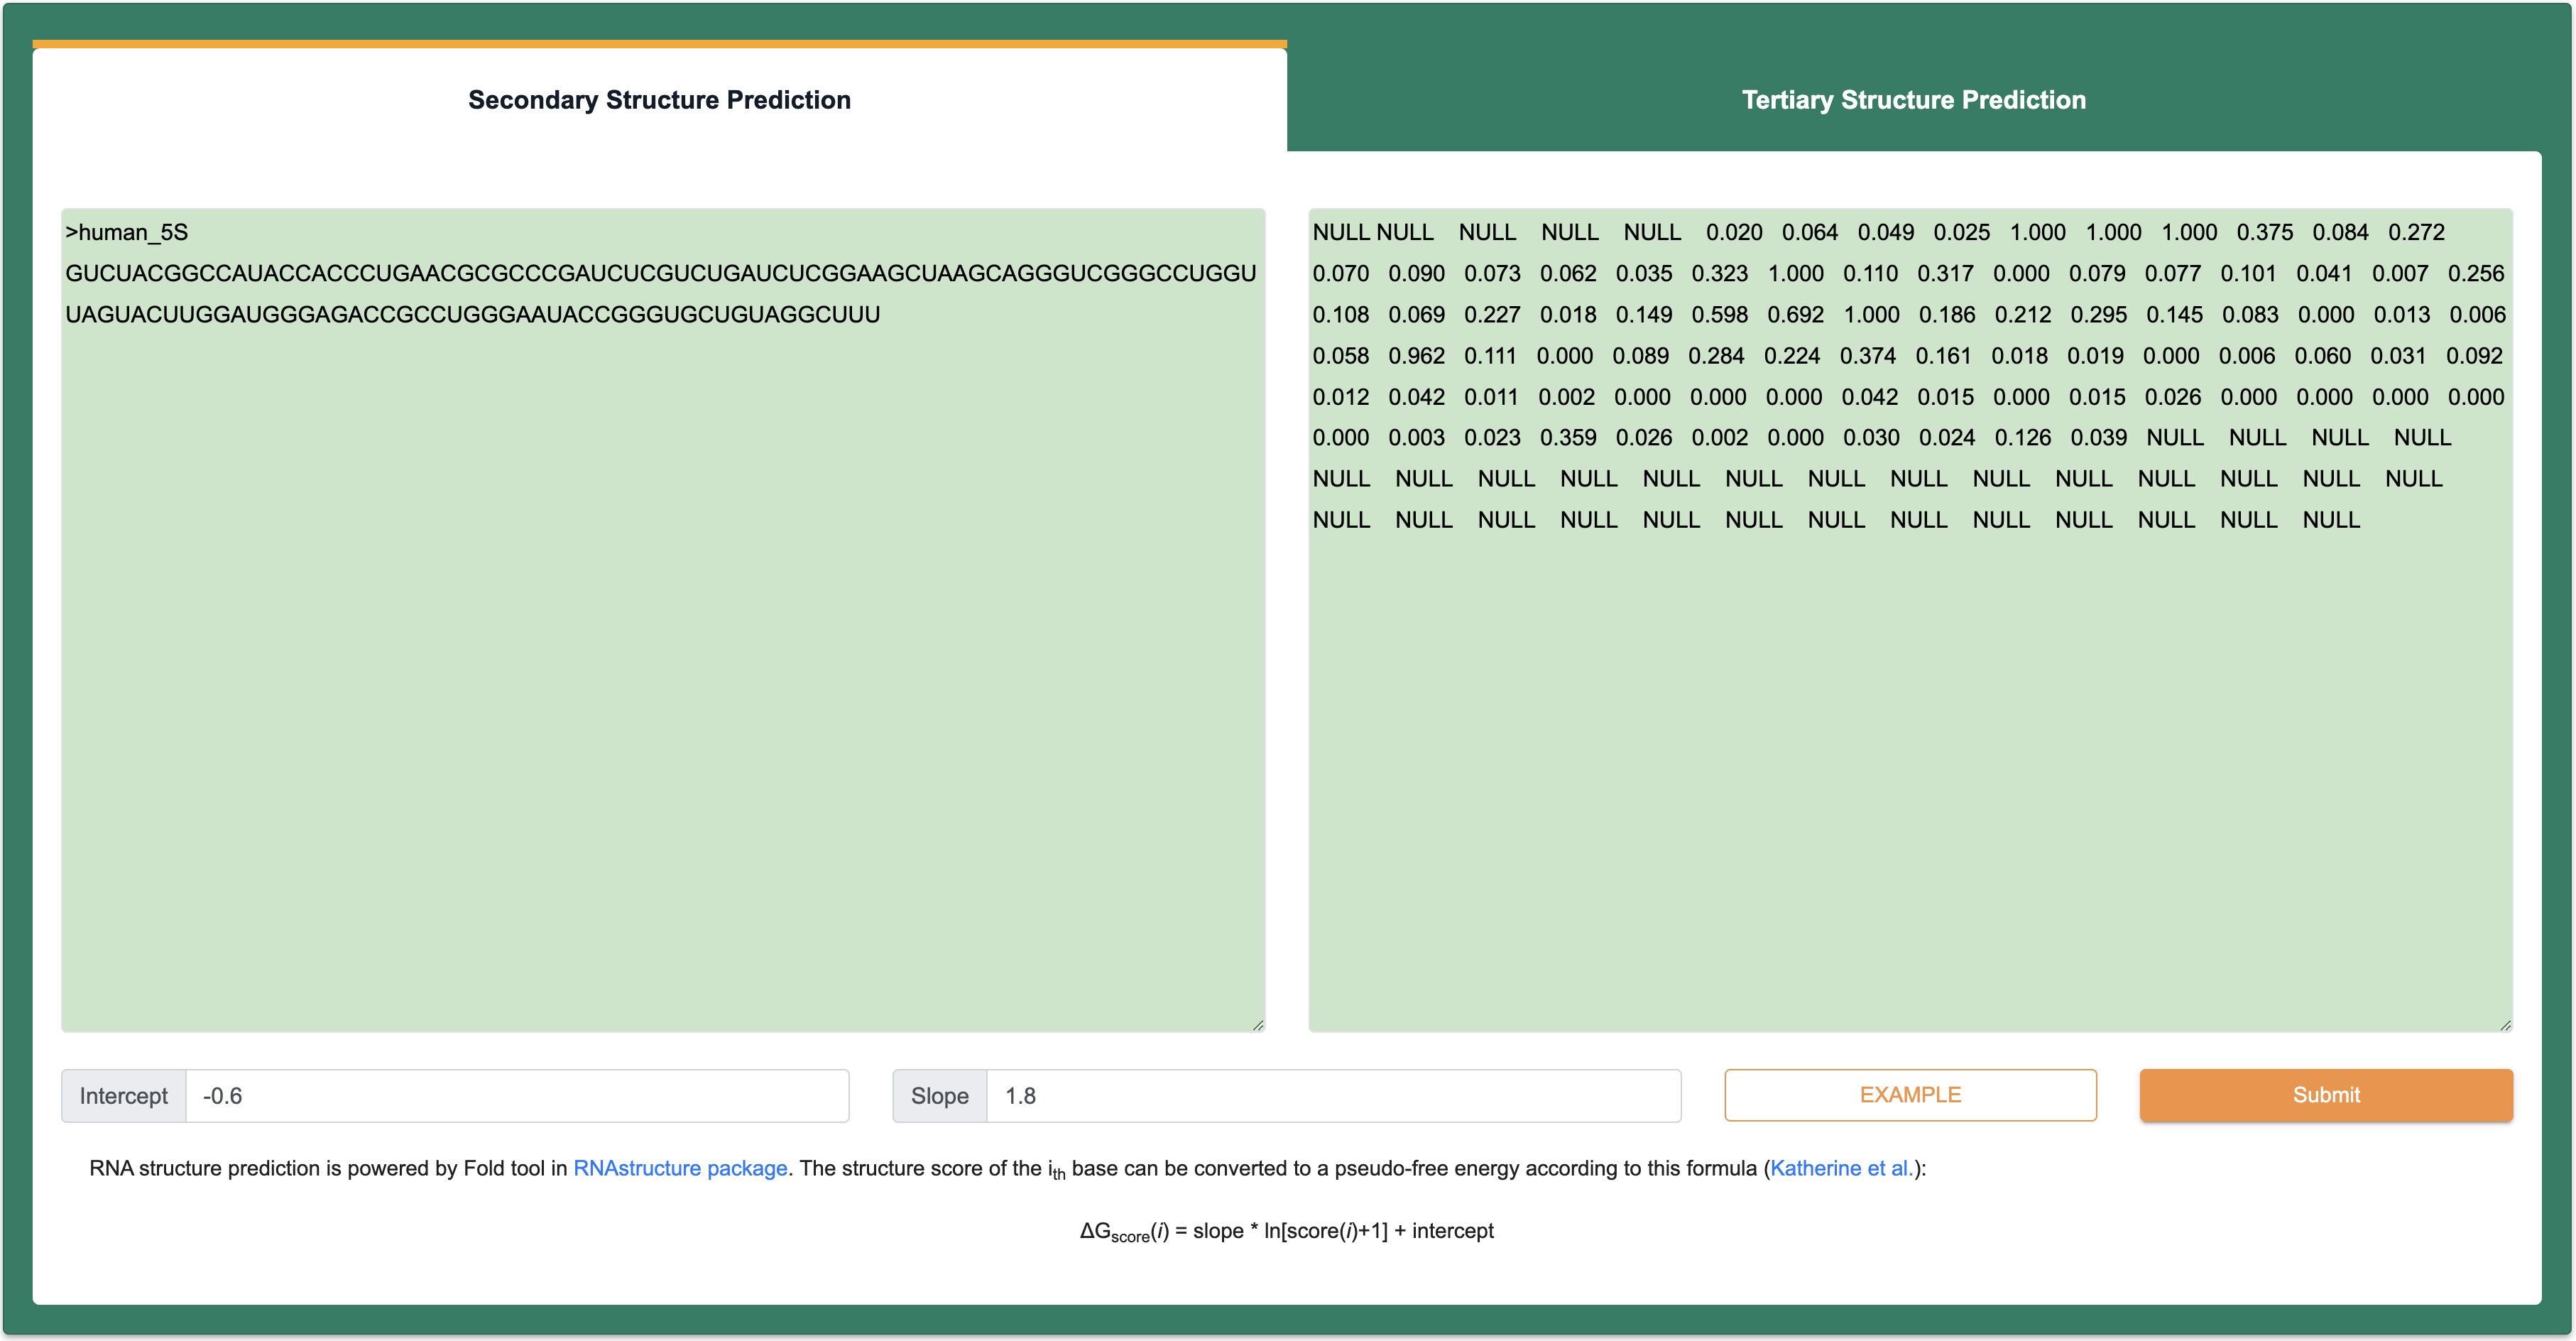
Step 1:The inputs of this module are RNA sequence and structure in FASTA format. Among them, the length of each input RNA sequence (A, U, C, G) is at least 1 nt, the total length is limited to 200 nt, and only the four types of AUCG bases are supported. However, the limitation of RNA length remains 1000nt in RNA secondary structure module. The length of each input RNA structure follows the same rules with input RNA sequence, the score of structural information can be represented not only by 0 to 1 (-1 is the null score), but also by a standard dot-bracket notation.
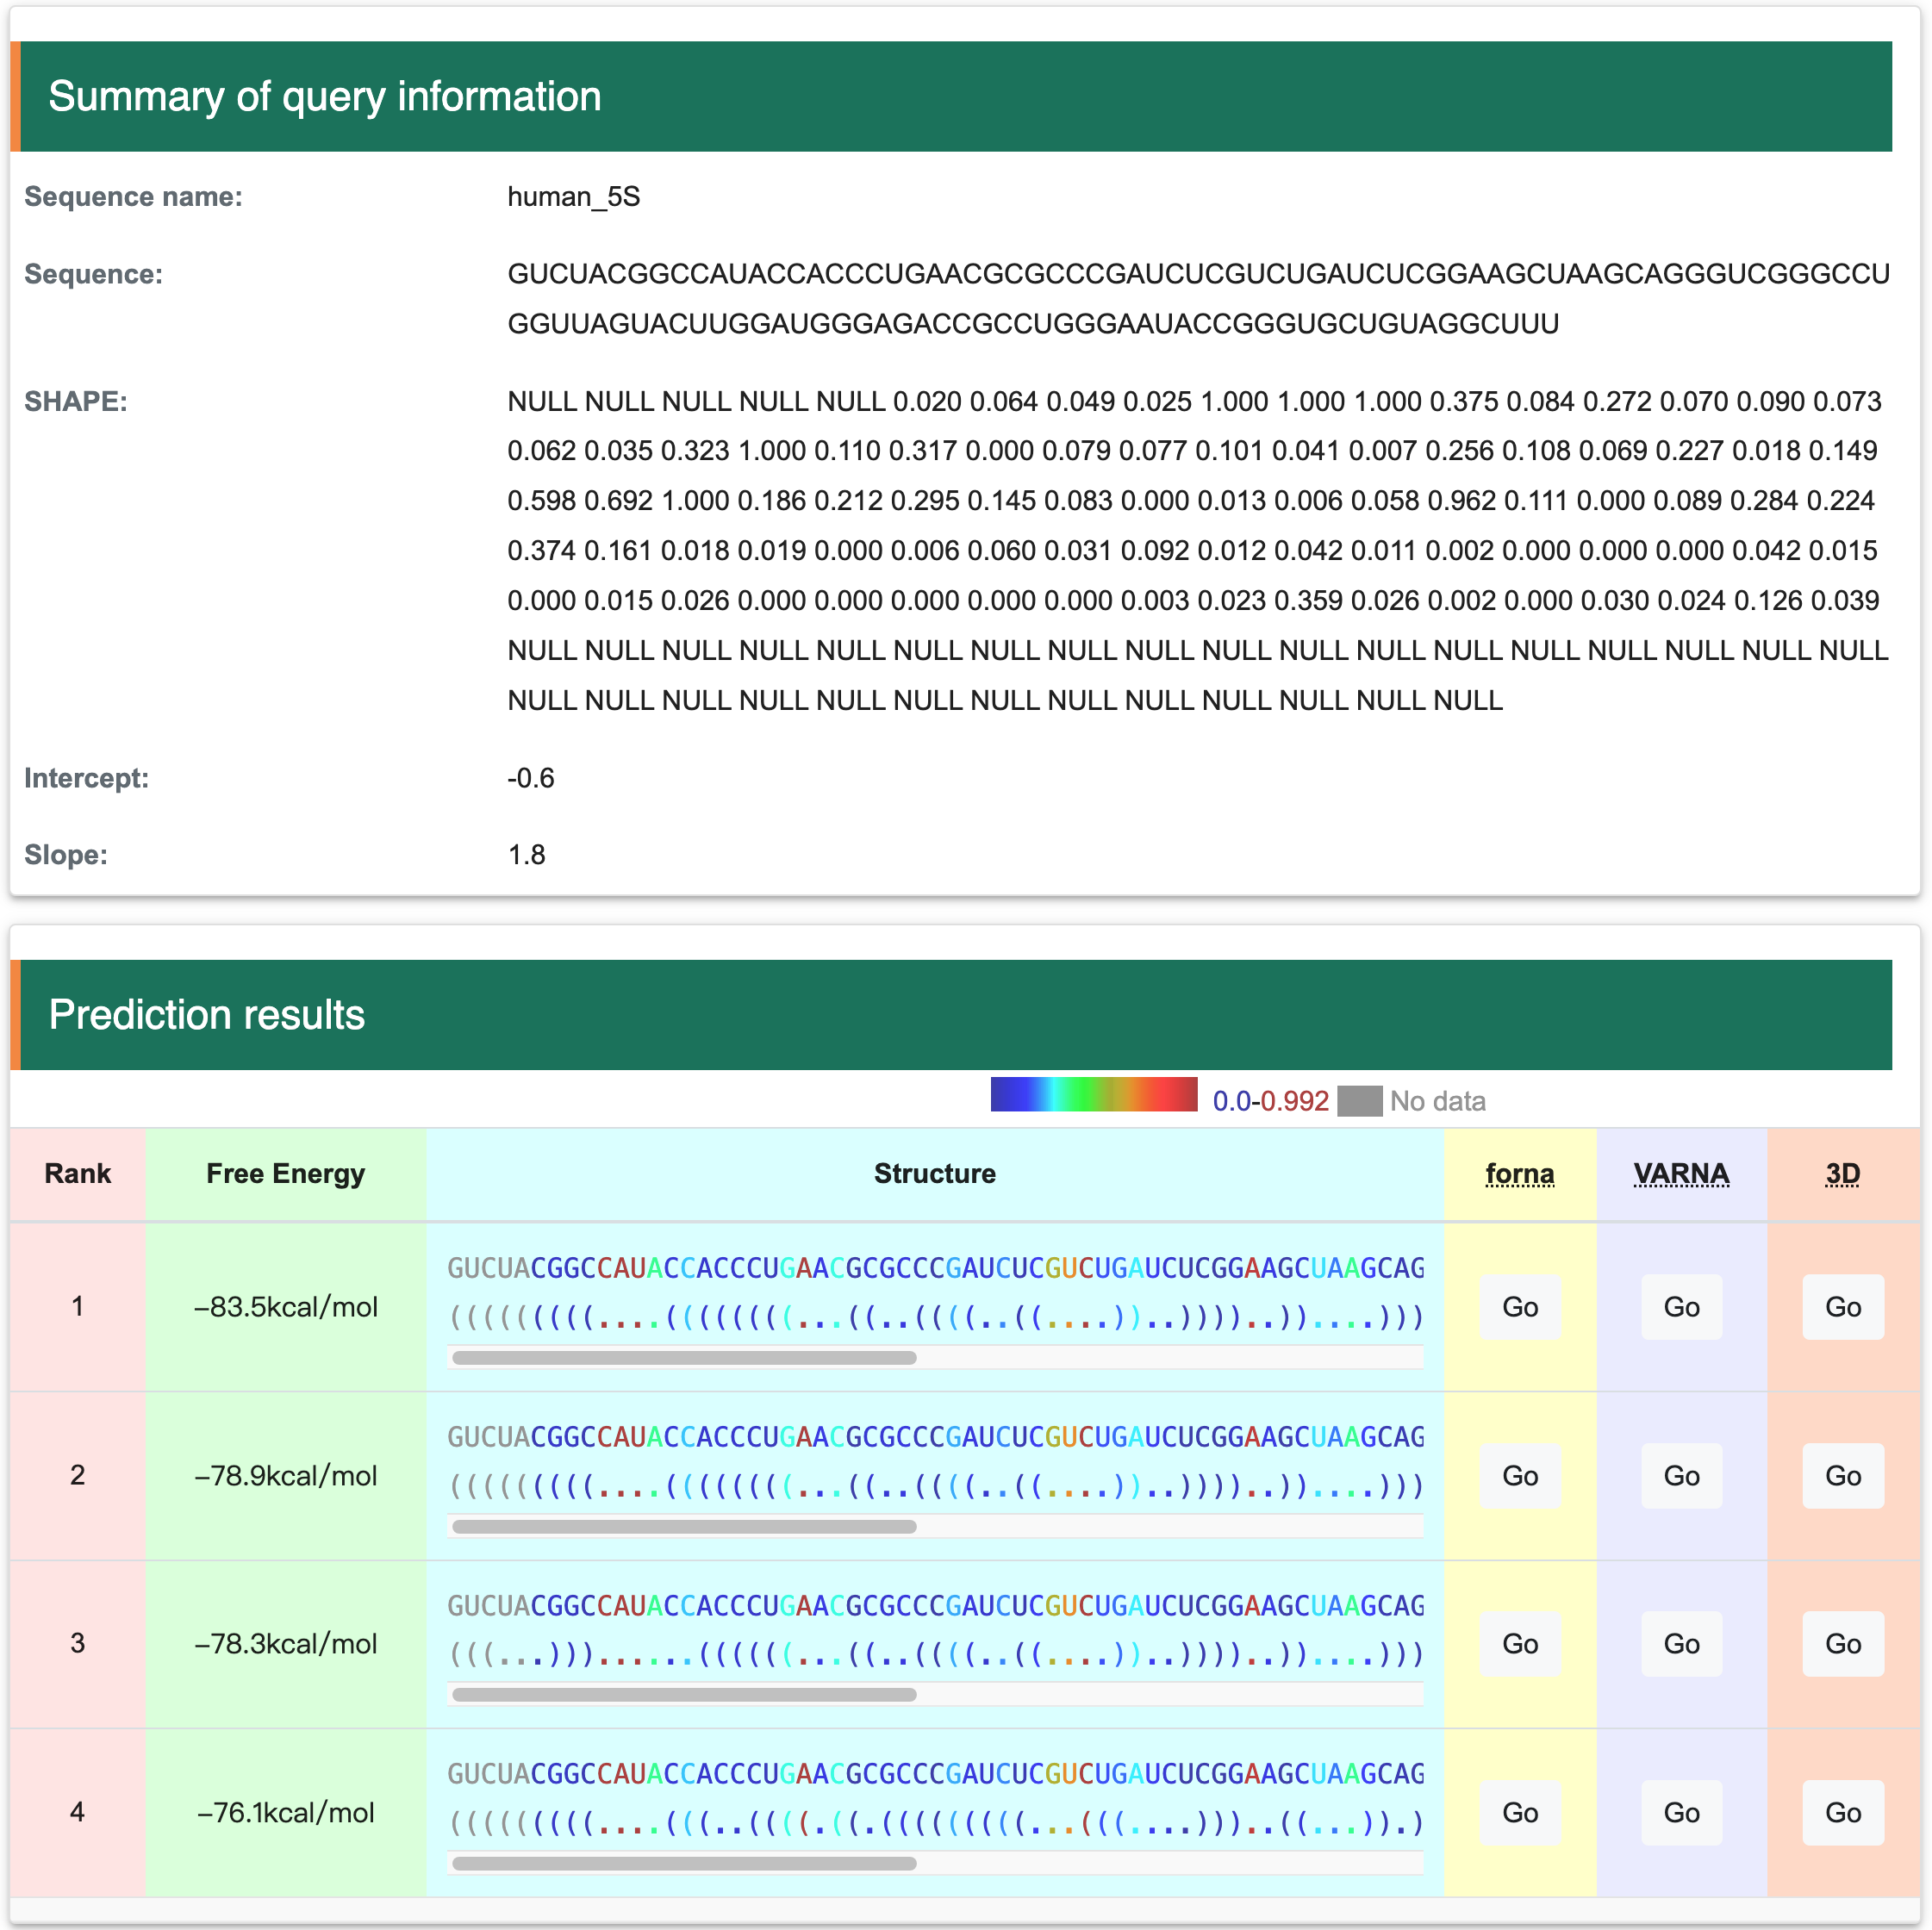
Step 2 After Clicking the ‘Submit’ button returns a page with the predicted structures. ‘Summary of query information’ panel contains input sequences, constraints and parameters. ‘Prediction results’ panel present a list of predicted structures ranked by free energy. Users can visualize structure with forna by clicking the ‘Go’ button, or copying a java command to visualize the structure with VARNA. In addition, RASP v2.0 also provides RNA tertiary structure prediction by clicking the ‘Go’ button in 3D column.
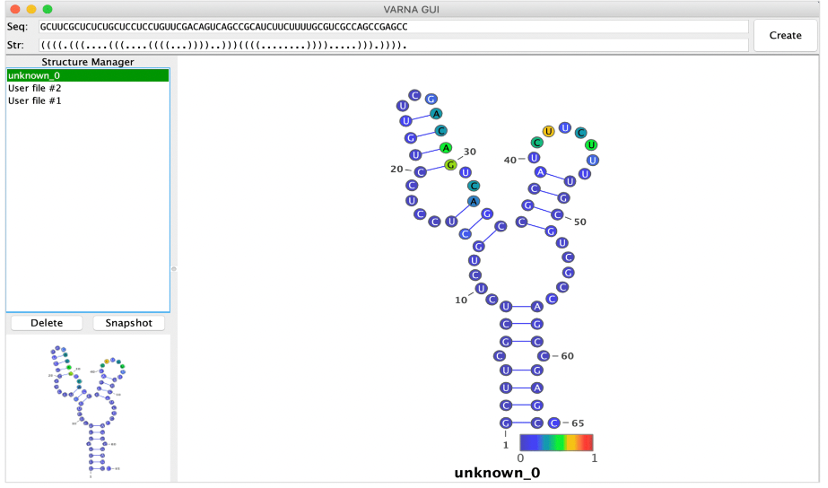
Step 3: As shown in the figures bellow, two methods are provided: Forna and VARNA. Forna is straightforward, requiring only a click to display the RNA secondary structure in a new window. VARNA, involves more steps but more flexiable: first, download it from http://varna.lri.fr/index.php and note its path on your computer. After downloading, copy the relevant command to your clipboard. Then, open your terminal, paste the command, and replace "VARNAv3-93.jar" with the correct path to the VARNAv3-93.jar file on your system. Press ENTER to obtain the results as shown below:
VARNA, involves more steps but more flexiable: first, download it from http://varna.lri.fr/index.php and note its path on your computer. After downloading, copy the relevant command to your clipboard. Then, open your terminal, paste the command, and replace "VARNAv3-93.jar" with the correct path to the VARNAv3-93.jar file on your system. Press ENTER to obtain the results as shown below:
3.3 Tertiary structure prediction
Step 1:The inputs of this module are RNA sequence and structure in FASTA format. Among them, the length of each input RNA sequence (A, U, C, G) is at least 1 nt, the total length is limited to 200 nt, and only the four types of AUCG bases are supported. However, the limitation of RNA length remains 1000nt in RNA secondary structure module. The length of each input RNA structure follows the same rules with input RNA sequence, the score of structural information can be represented not only by 0 to 1 (-1 is the null score), but also by a standard dot-bracket notation.
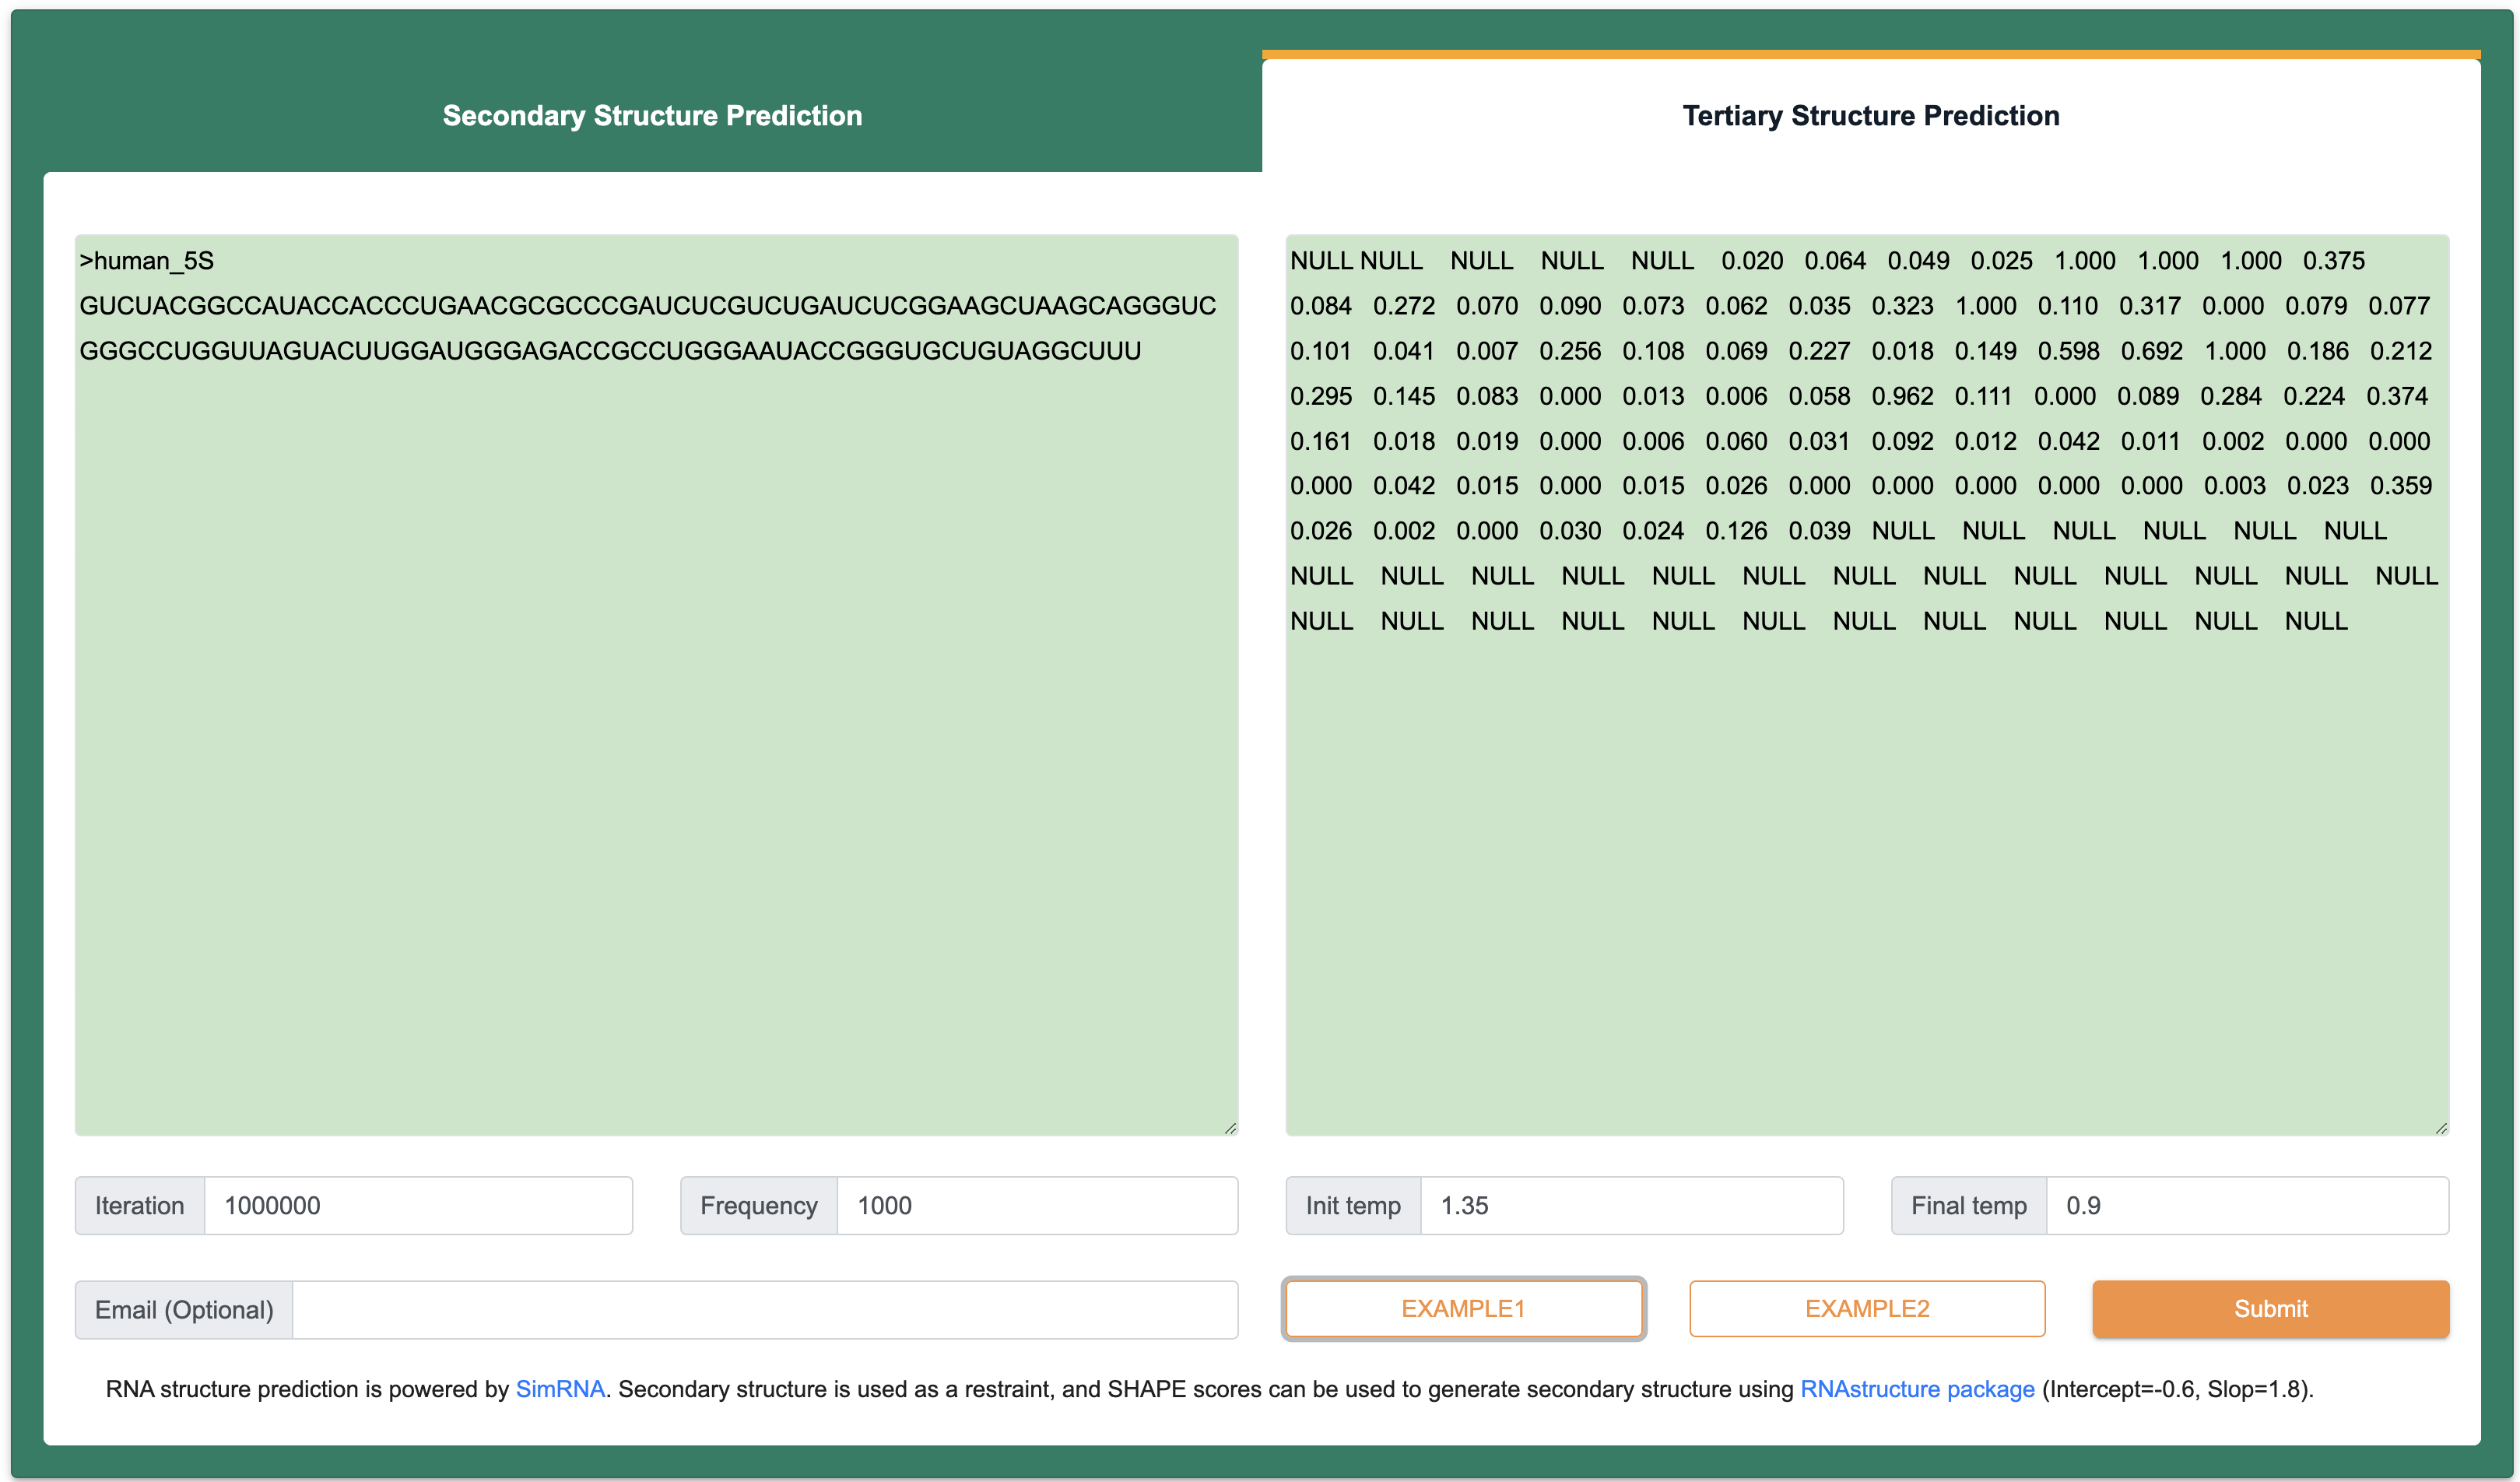
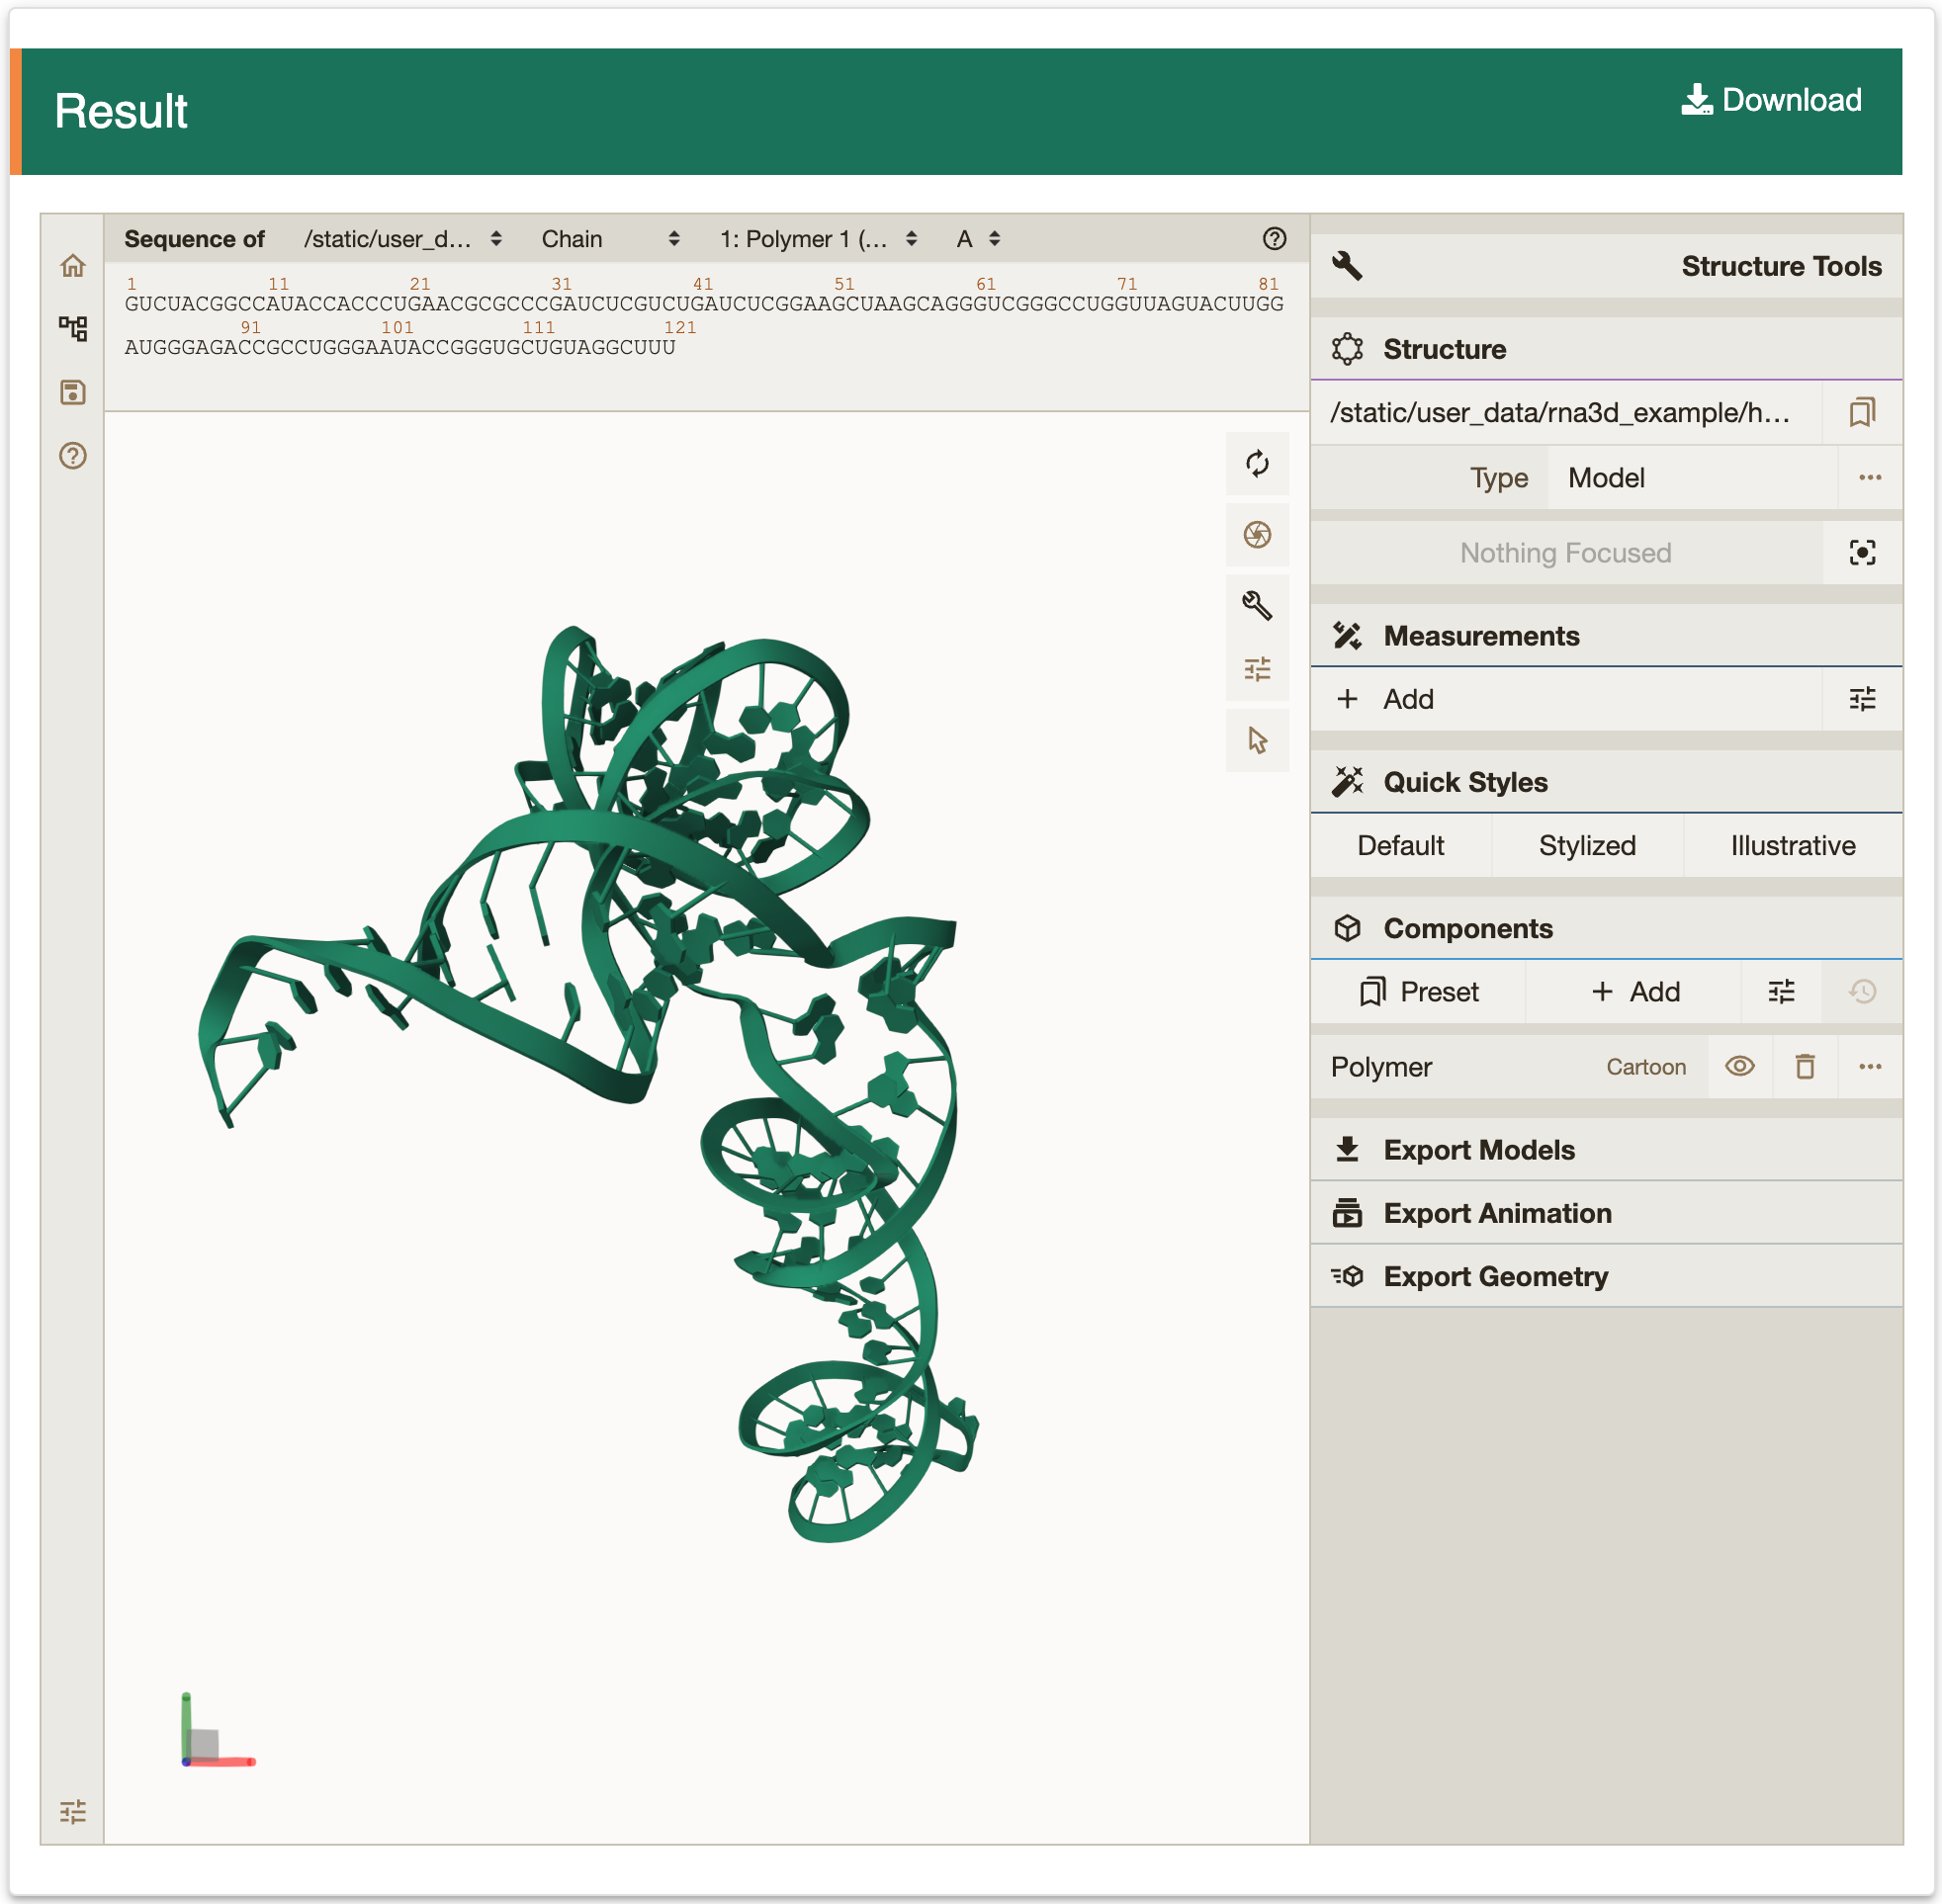
Step 2: After Clicking the ‘Submit’ button returns a page with the predicted structures. ‘Summary of query information’ panel contains input sequences, constraints and parameters. ‘Prediction results’ panel present a list of predicted structures ranked by free energy. Users can visualize structure with forna by clicking the ‘Go’ button, or copying a java command to visualize the structure with VARNA. In addition, RASP v2.0 also provides RNA tertiary structure prediction by clicking the ‘Go’ button in 3D column.
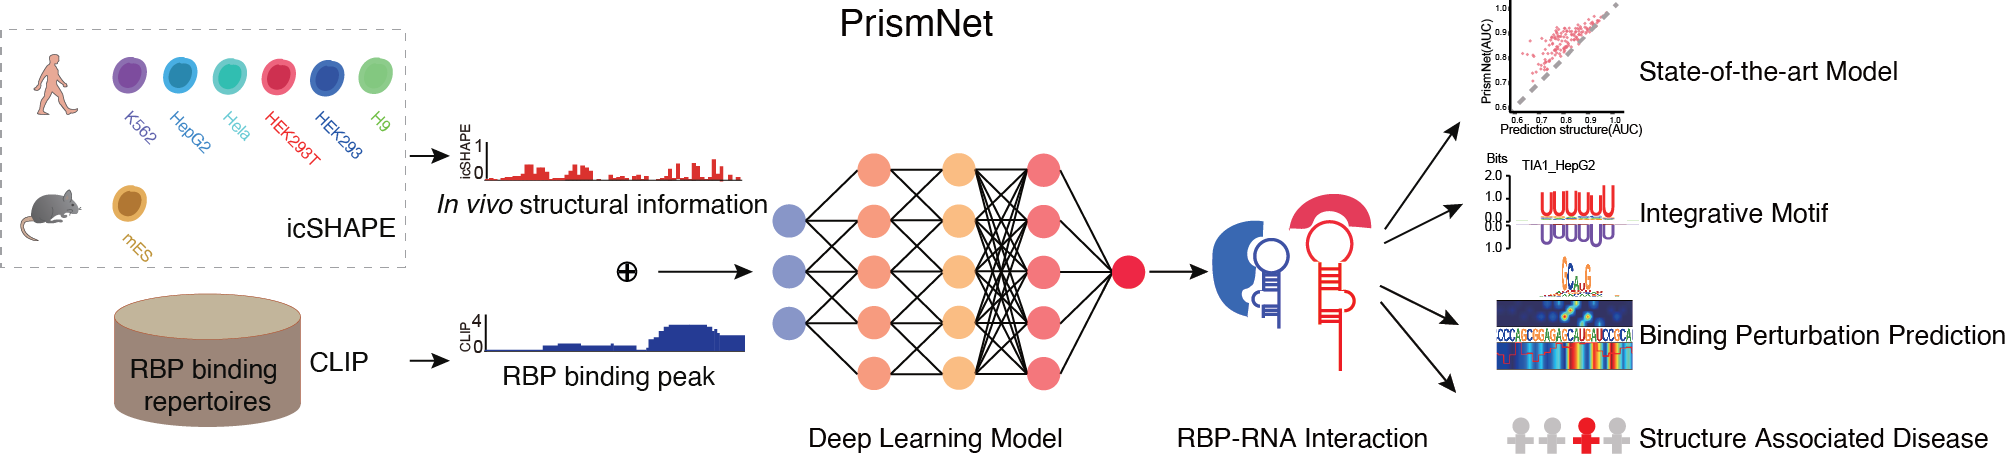
3.4 RBP binding predictionRASP v2.0 provides the RBP binding prediction module, which currently supports 168 human RBP binding predictions from different cell lines.
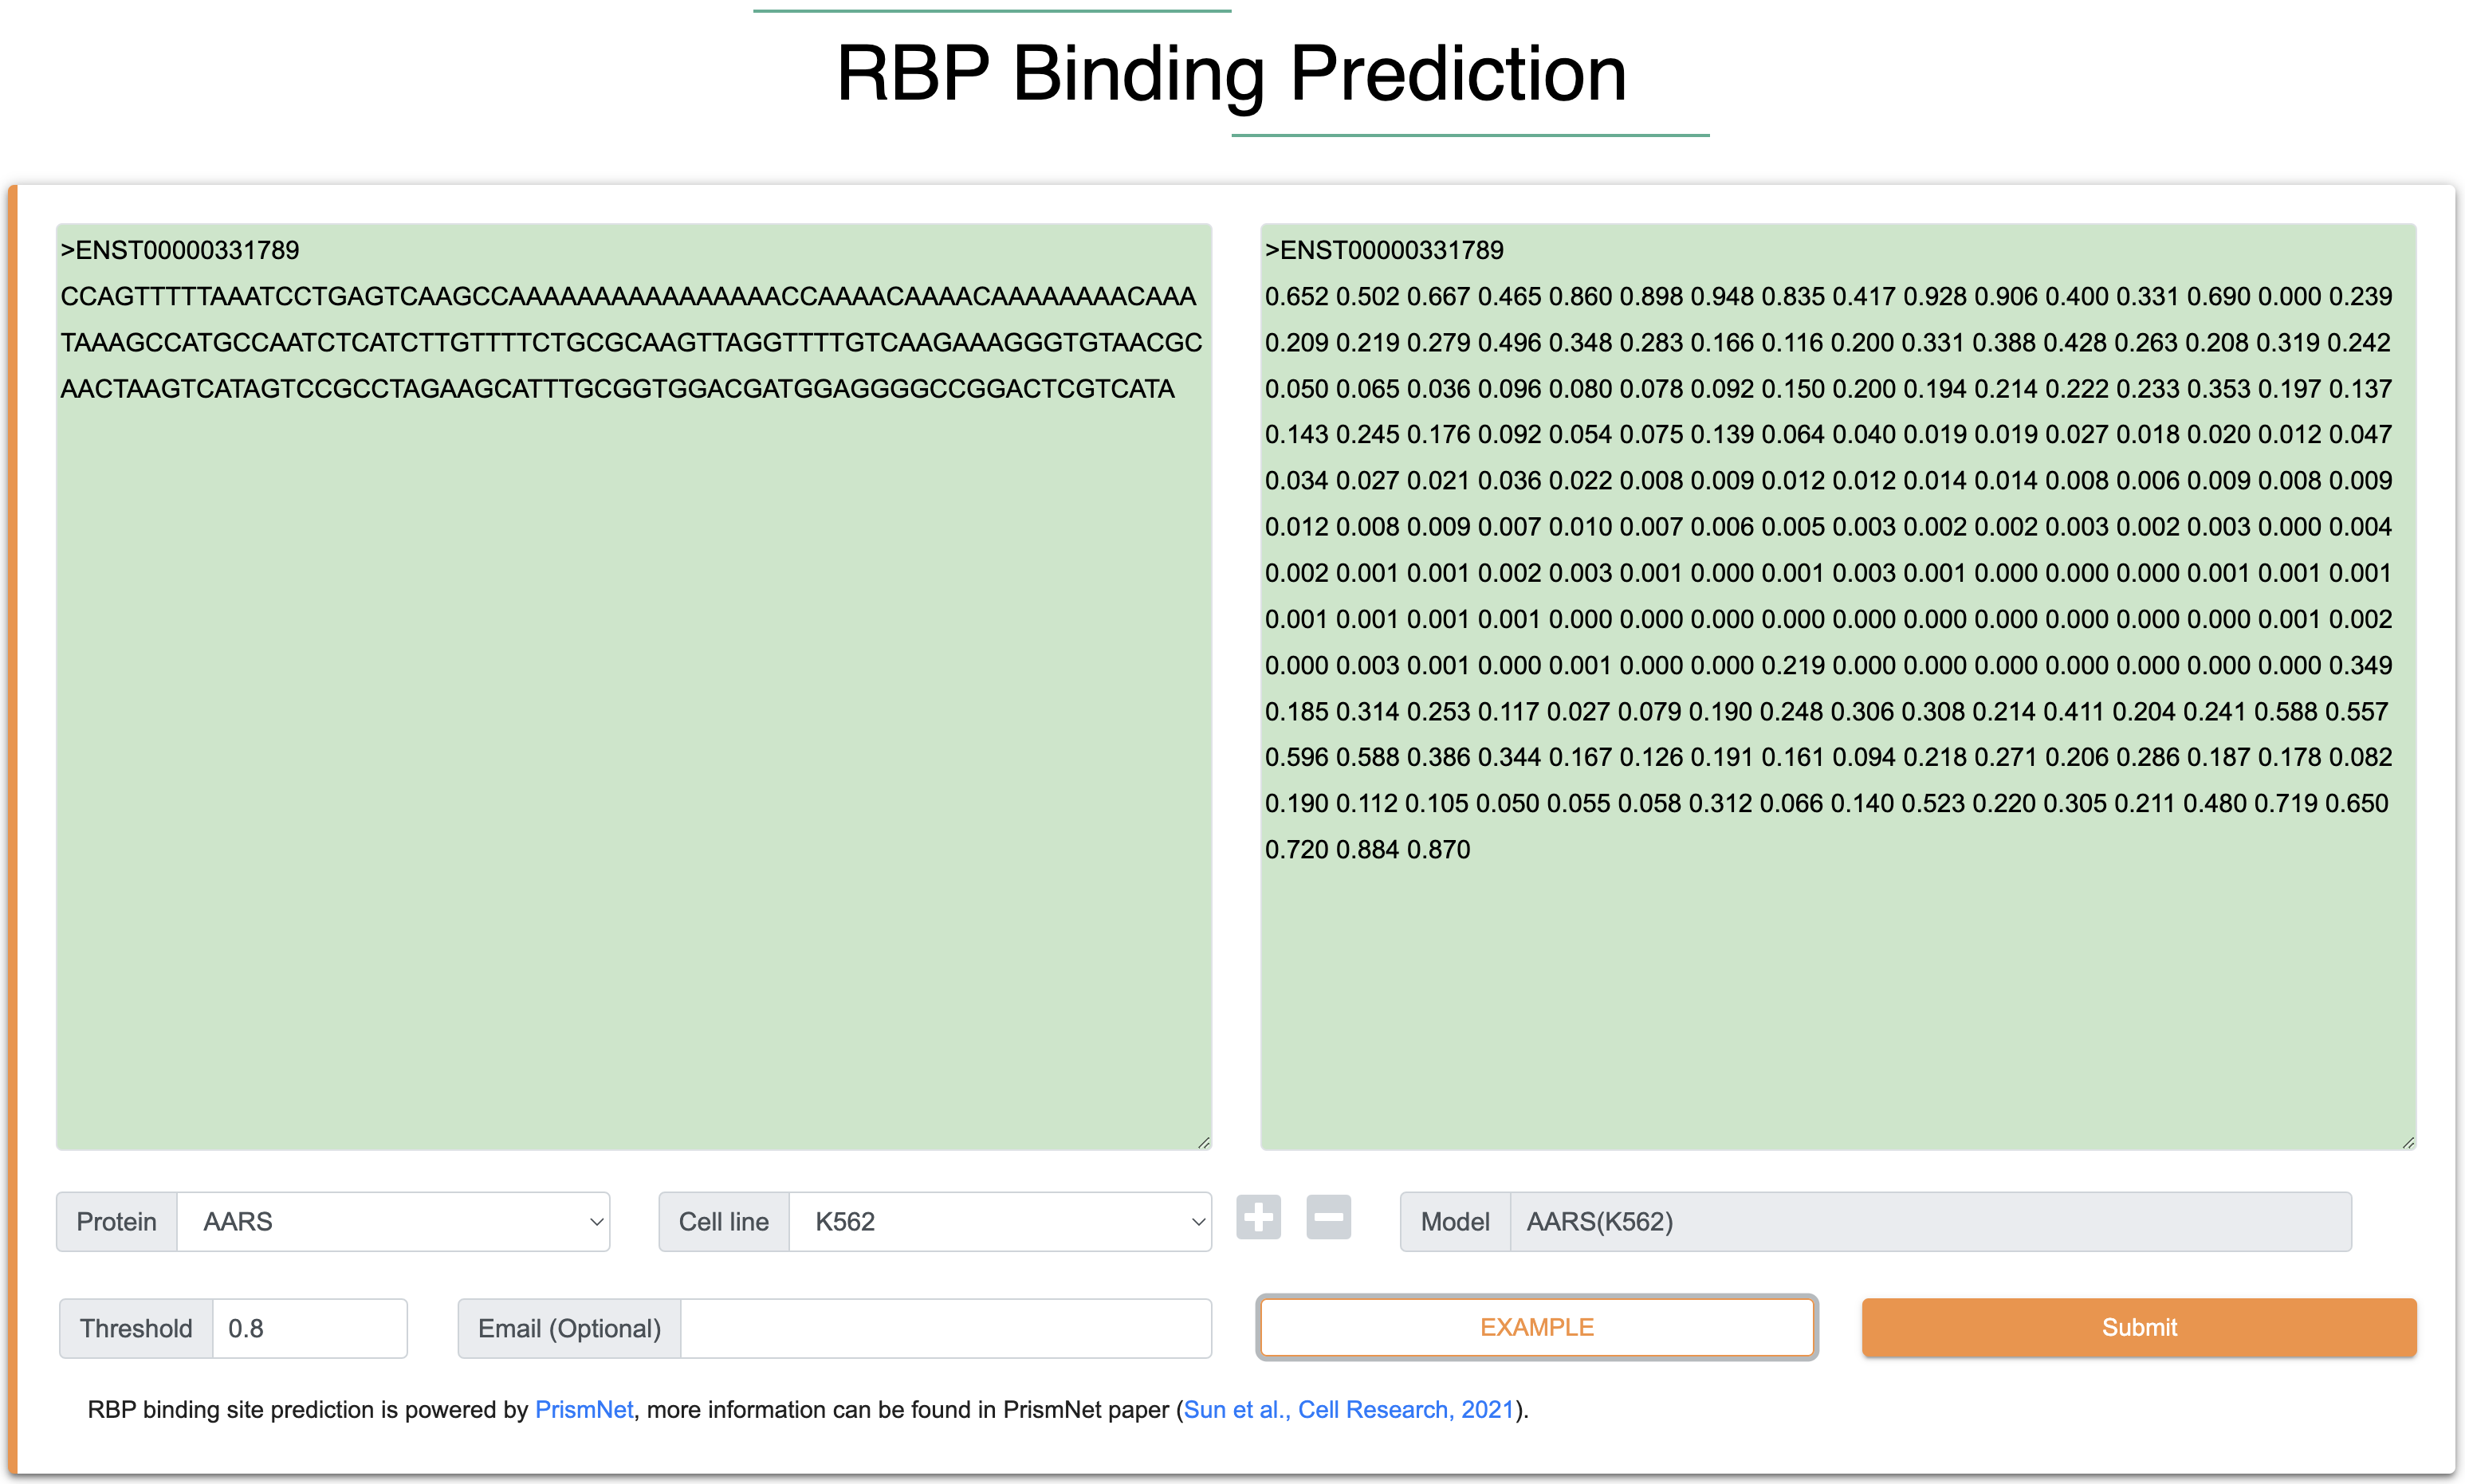
Step 1:The inputs of this module are RNA sequence and structure in FASTA format. Among them, the length of each input RNA sequence (A, U, C, G) is at least 101 nt, the total length is limited to 1000 nt, and only the four types of AUCG bases are supported. The length of each input RNA structure follows the same rules with input RNA sequence, and the score ranges from 0 to 1 (-1 is the missing structure siginal). In general, icSHAPE data defaults to a score between 0 and 1 through its data processing, whereas the other methods require to normalized the structure score to 0 to 1 to perform RBP prediction. We provide two normalization strategy in this module, which able to automatically convert user upload data to 0-1 range.
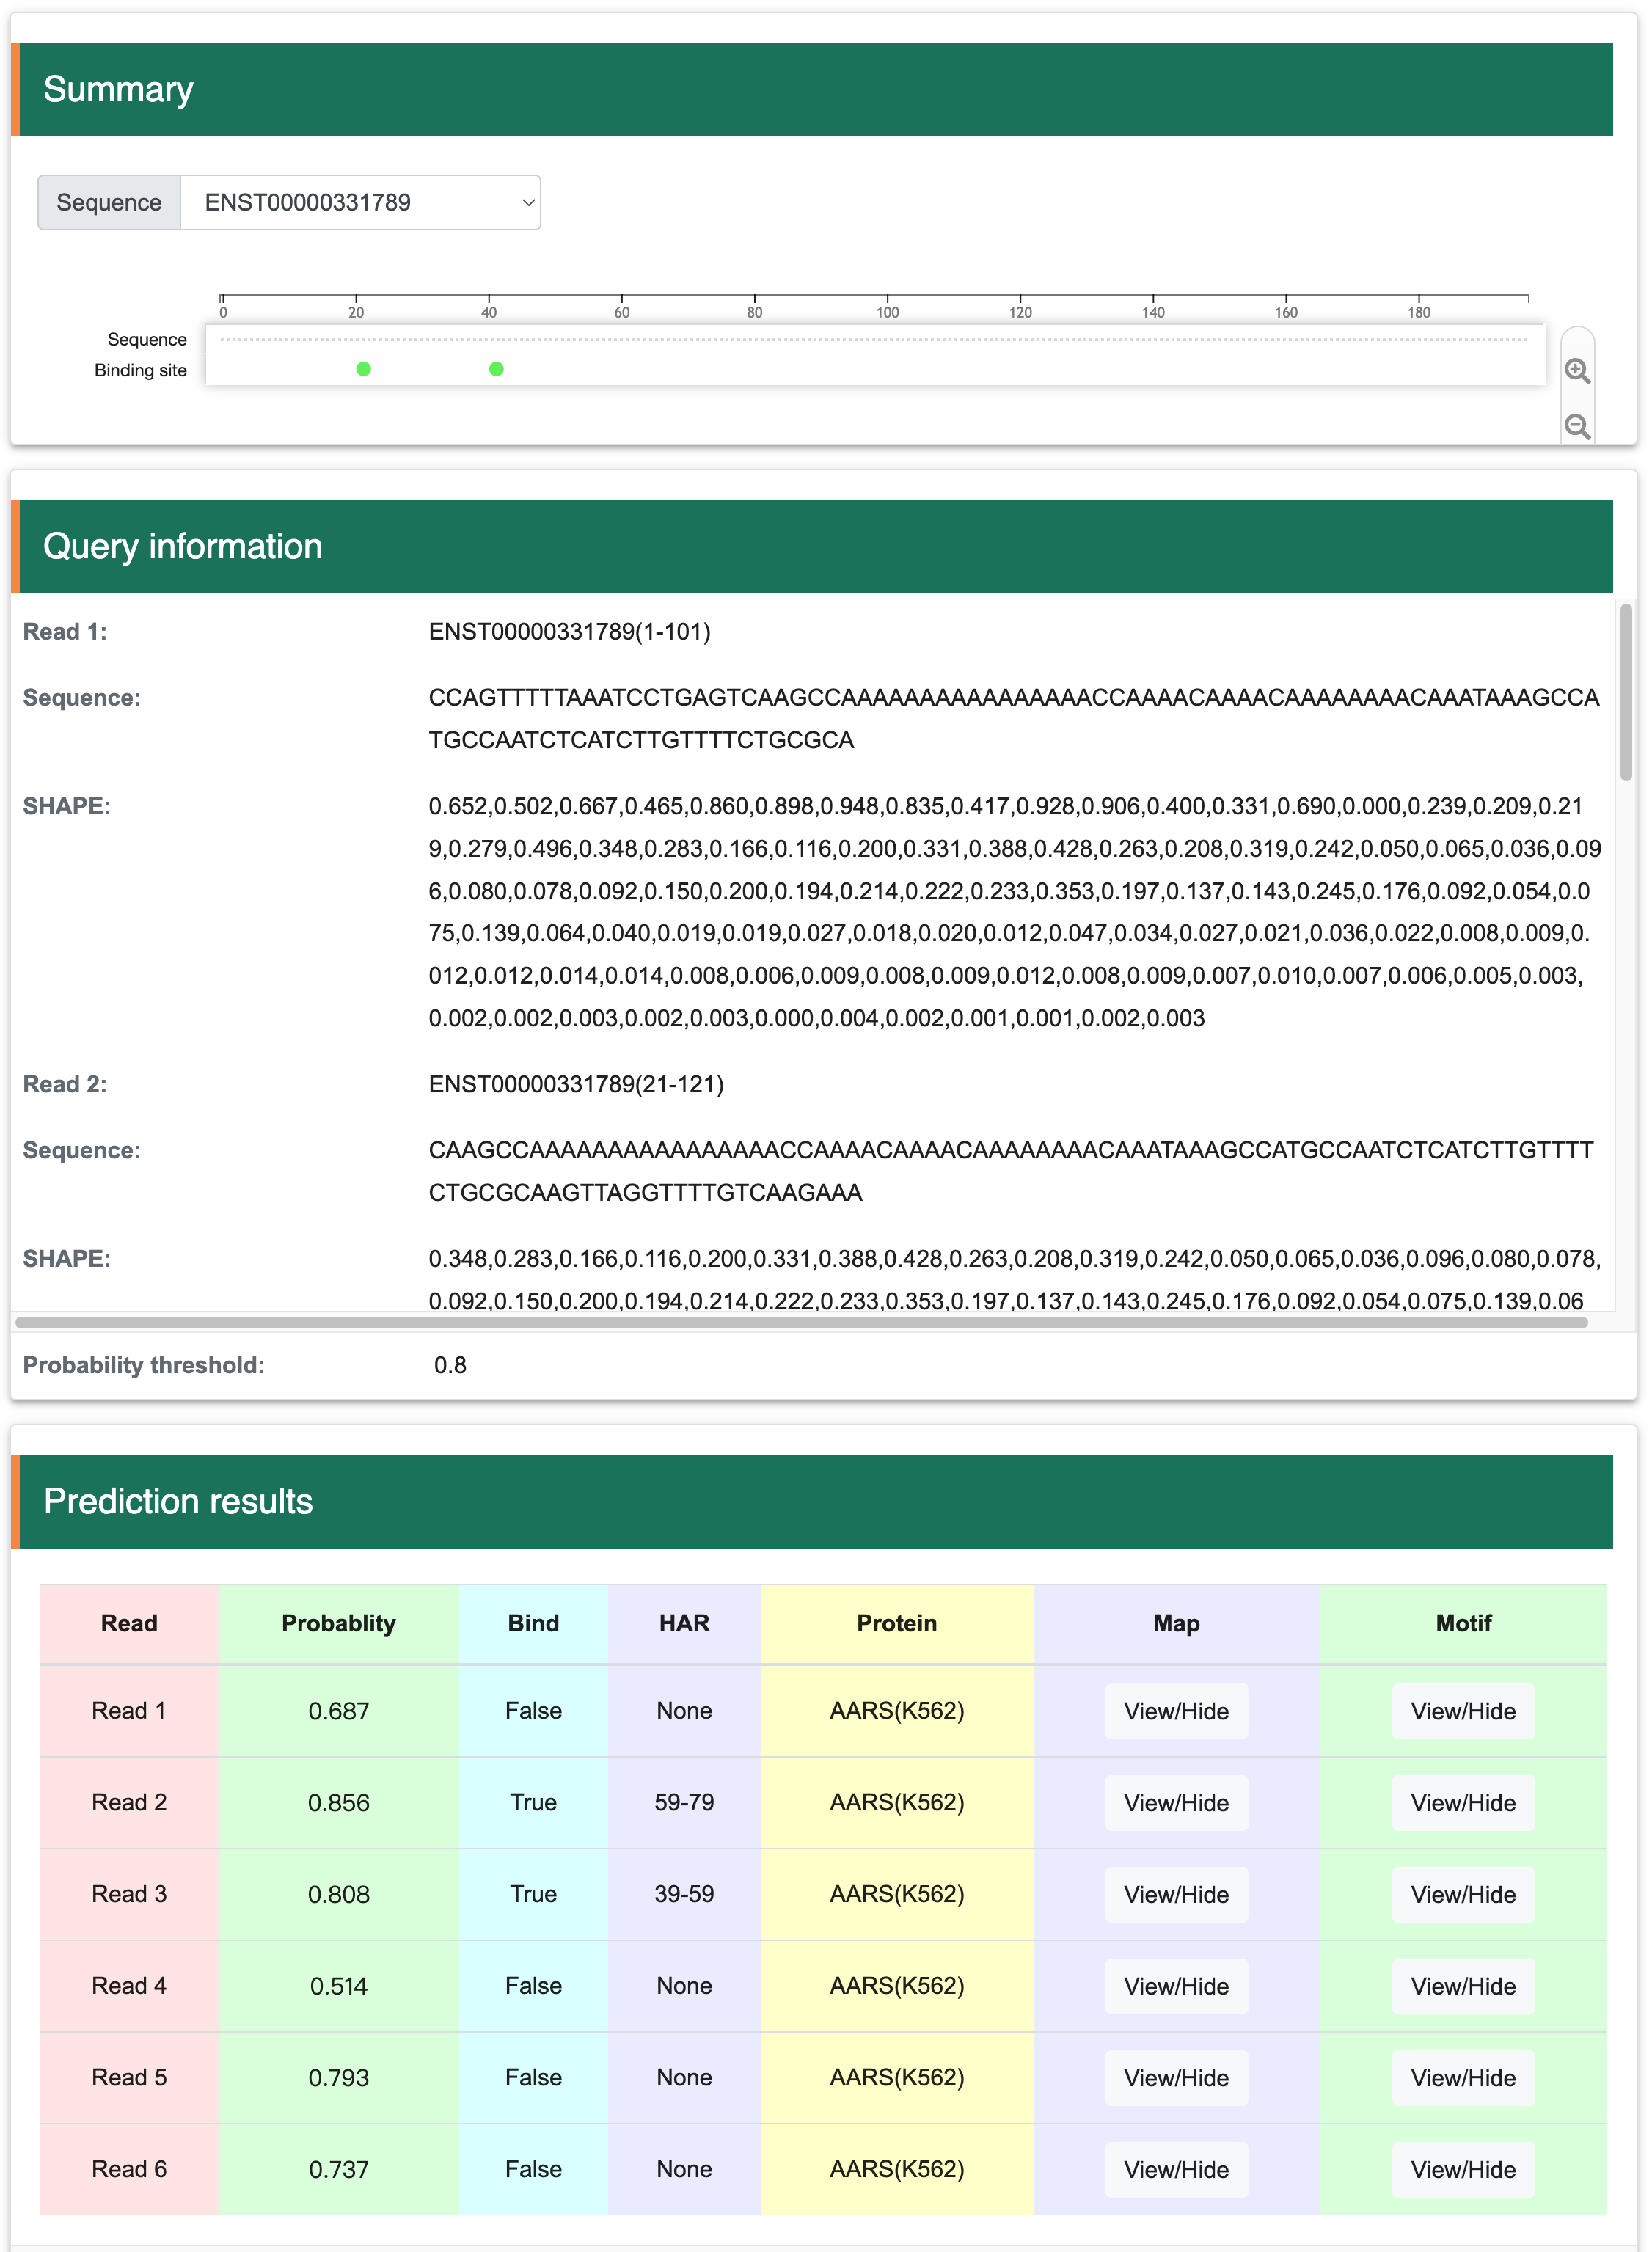
Step 2:The output results contain four parts, the ‘Summary’ shows the RBP binding sites of each input sequence. Users can click the binding sites for details of bound RBPs. The ‘Query information’ shows all the sequential information prepared for the prediction. The ‘Prediction results’ would show the basic information and inferred results of all 101 nt sequences, such as read number, binding probability, binding or unbinding, high attention region (HAR) of saliency map, targeted proteins, saliency maps and motifs.
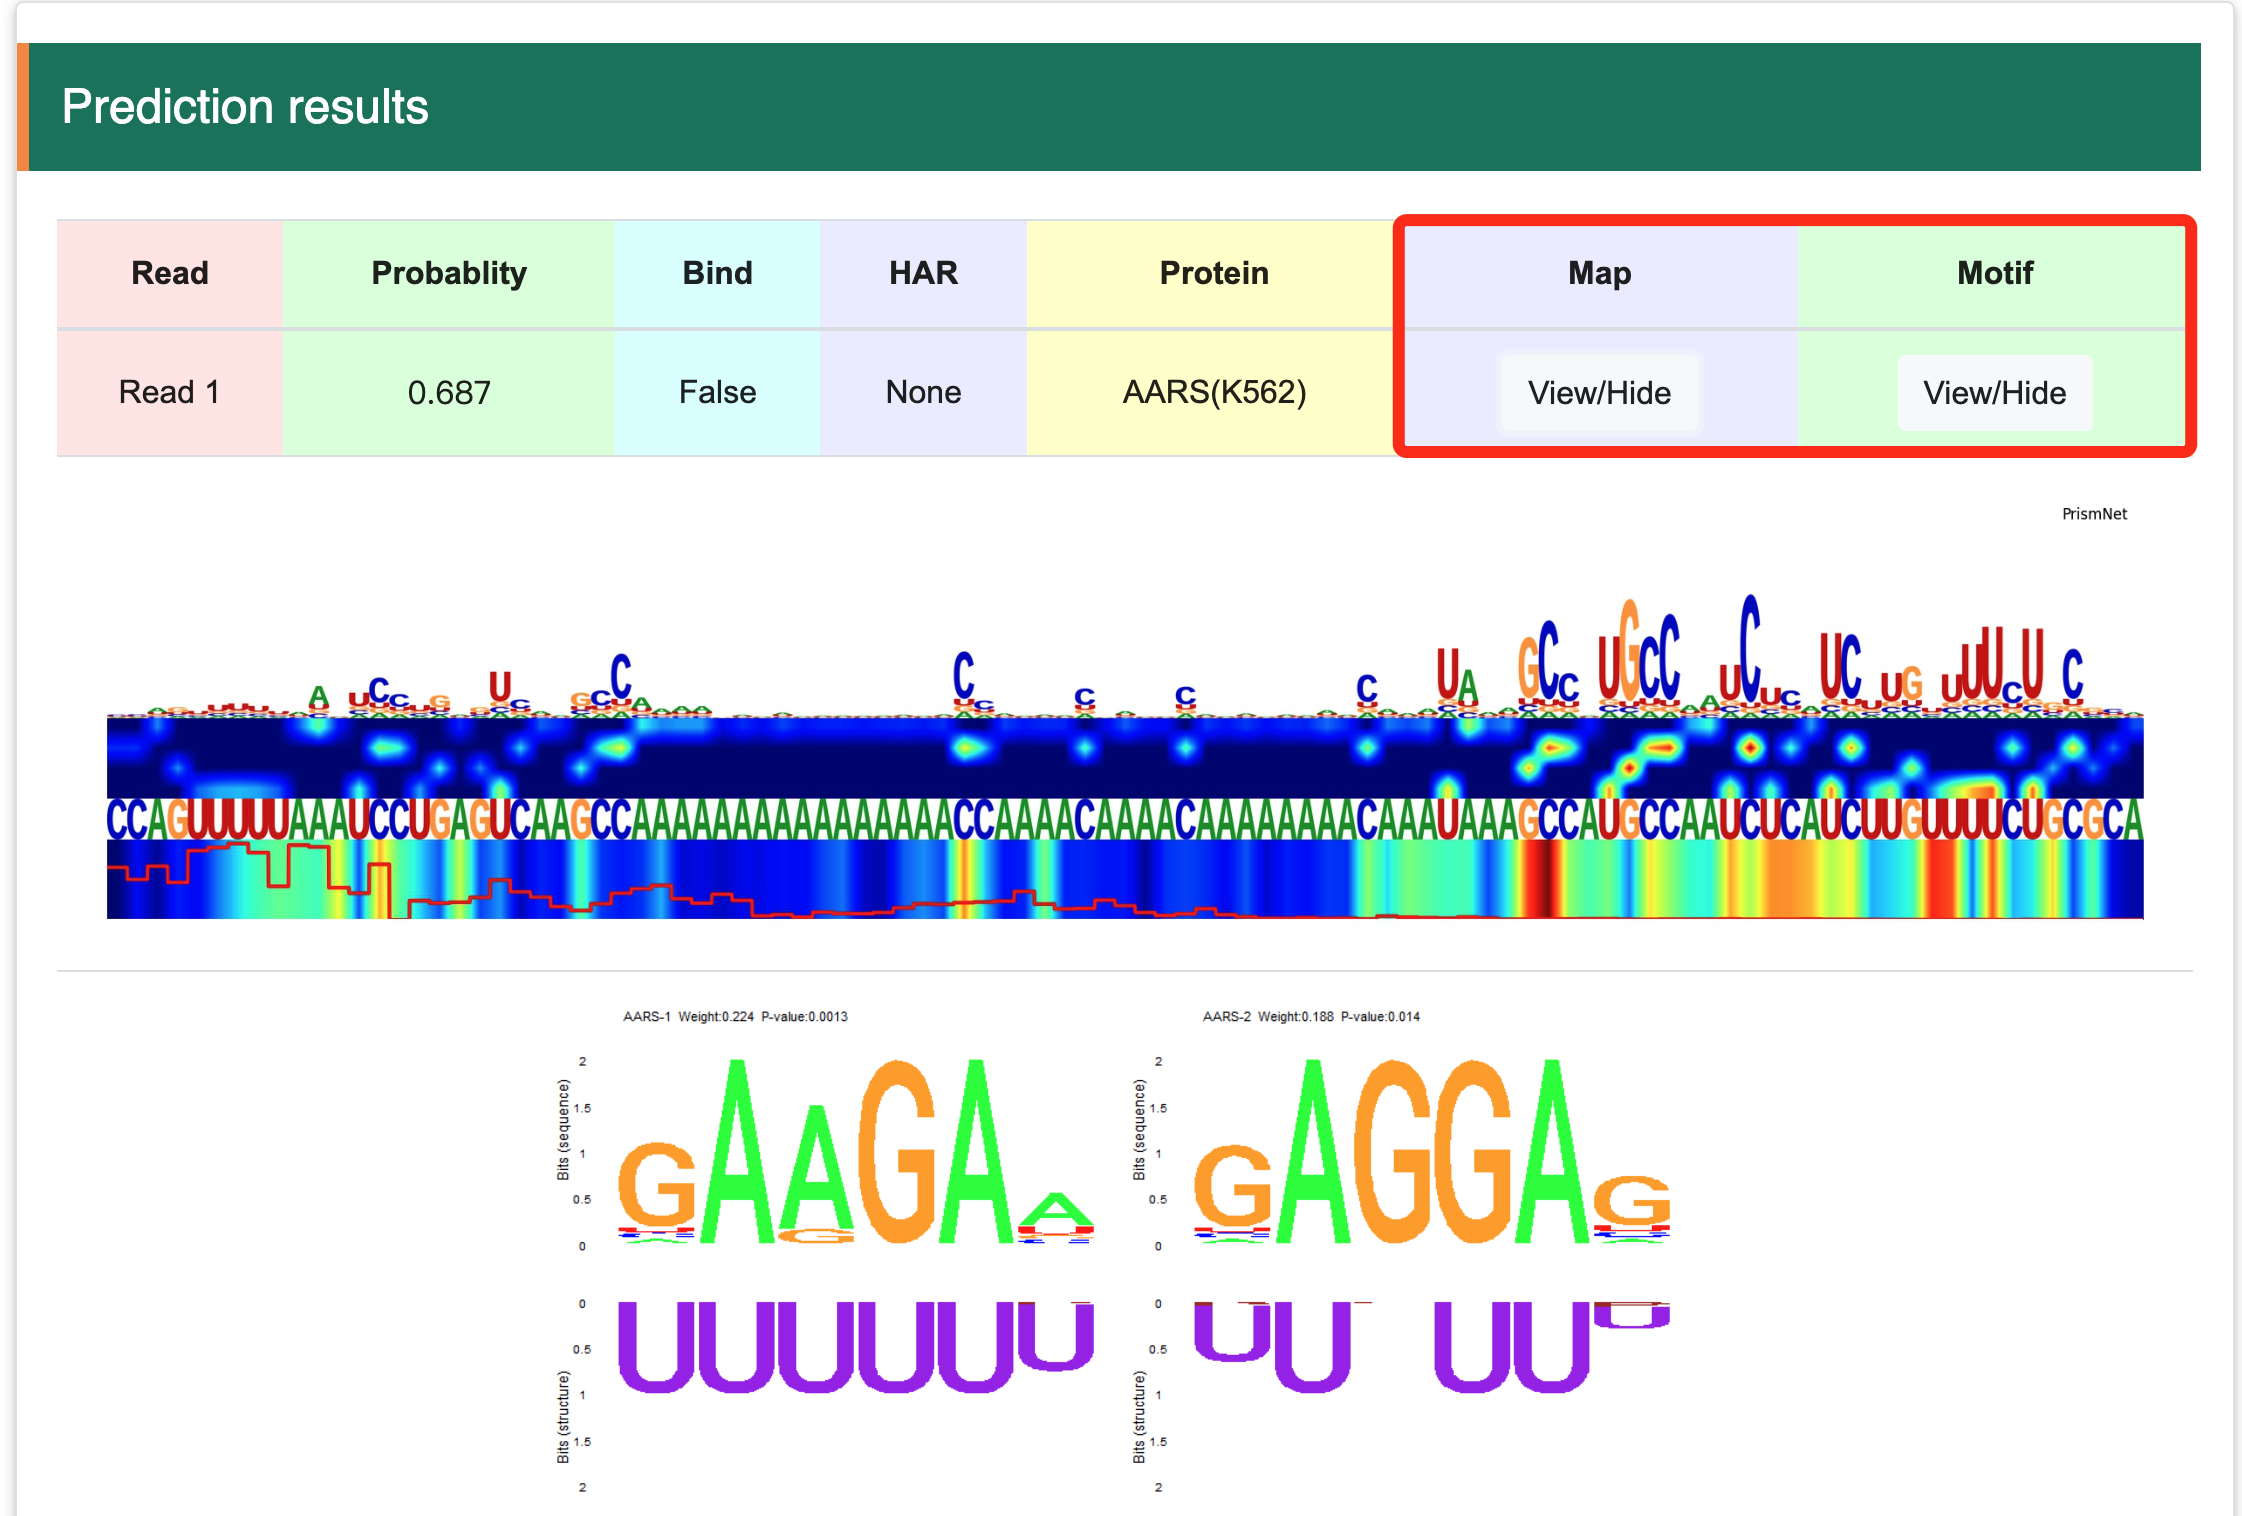
Step 3:Visualization of saliency maps and motifs.
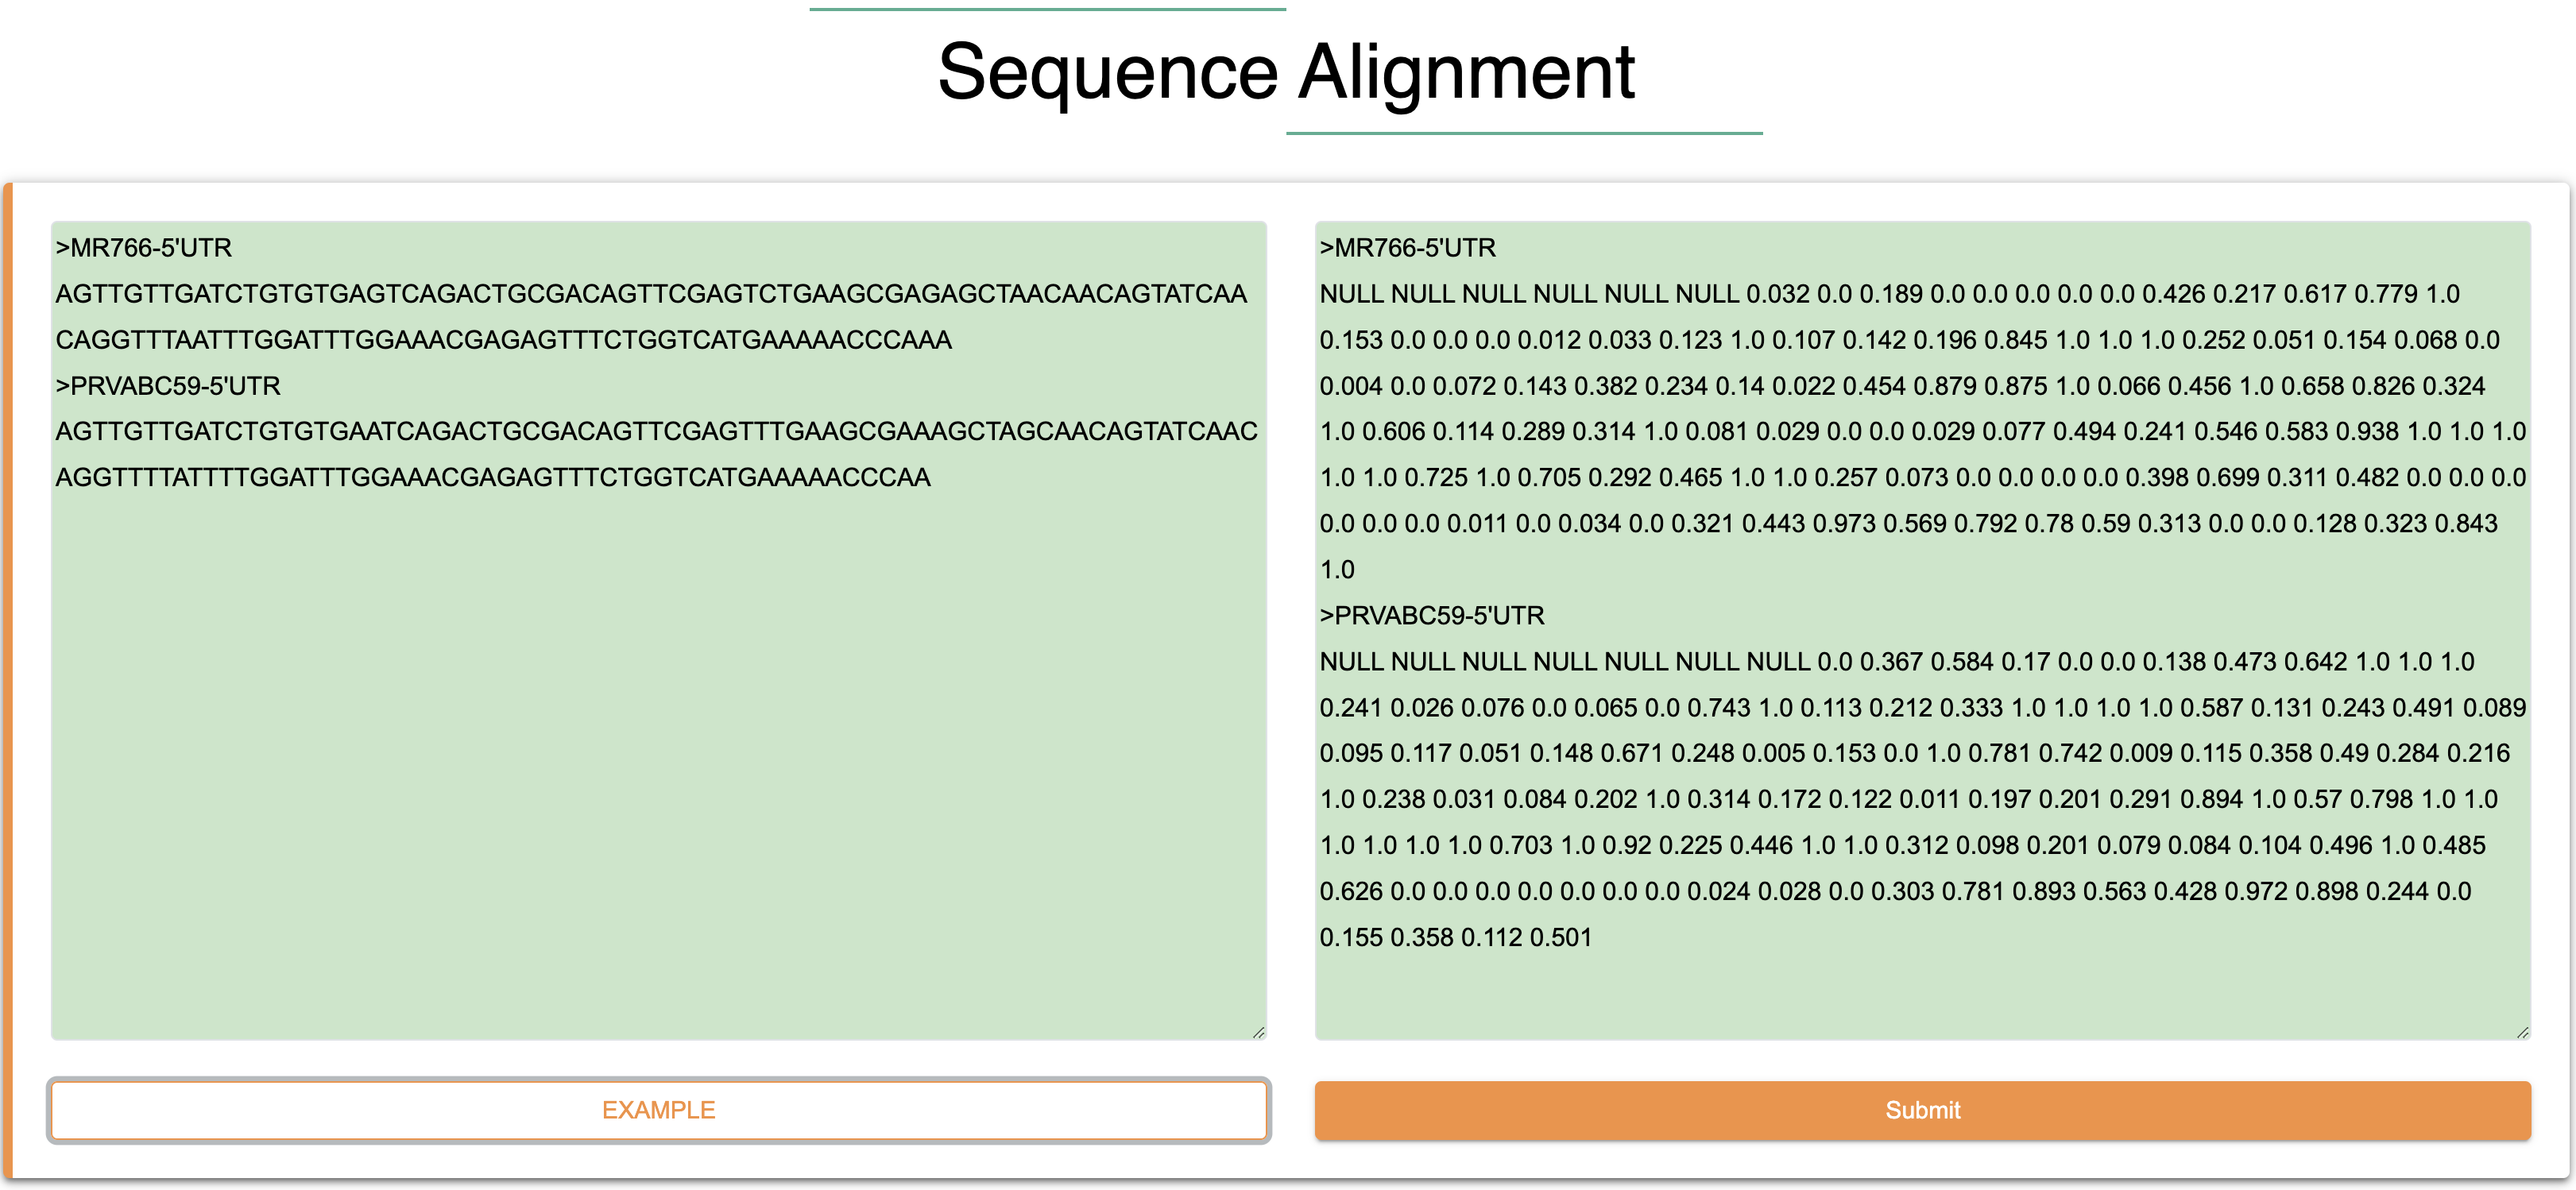
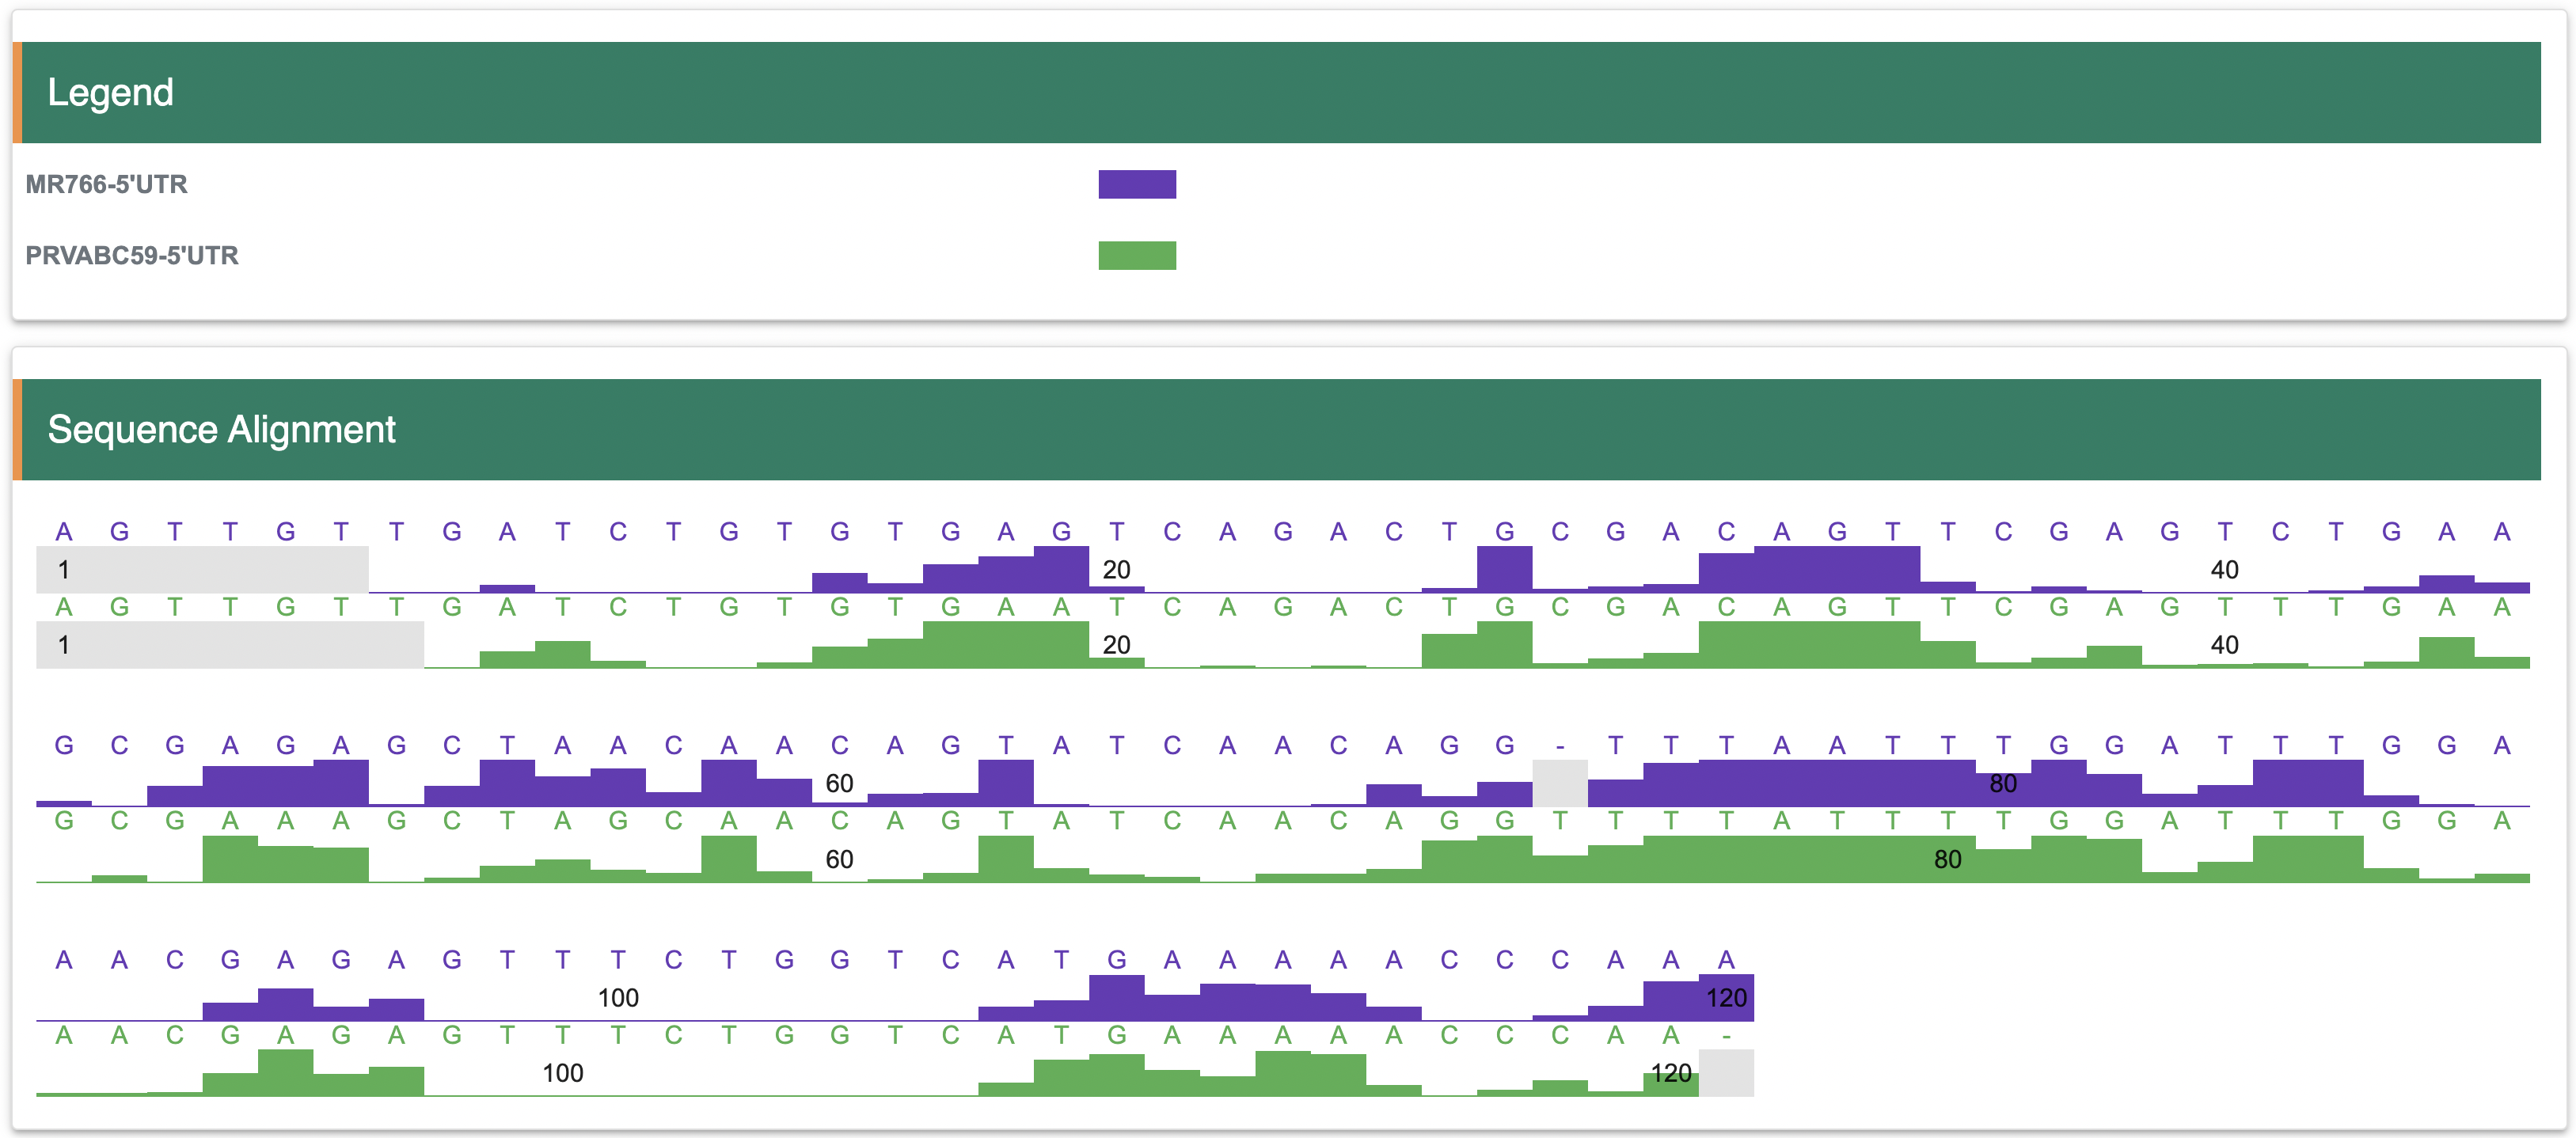
3.5 Sequence alignmentIf a user is interested in the structure of homologous sequences, they can compare the structure score of homologous sequences through the ‘Alignment’ page. Multiple sequences and corresponding structure scores can be input.
Step 1:While the sequence comparison functionality in RASP can be used to compare the variability of structural scores in different datasets, this approach can only be done for a limited number of target sequences (<=3).
Step 2:The structure scores comparsion between tow datasets will be show the in the figure
-
4. Add interested data into analysis module from result page
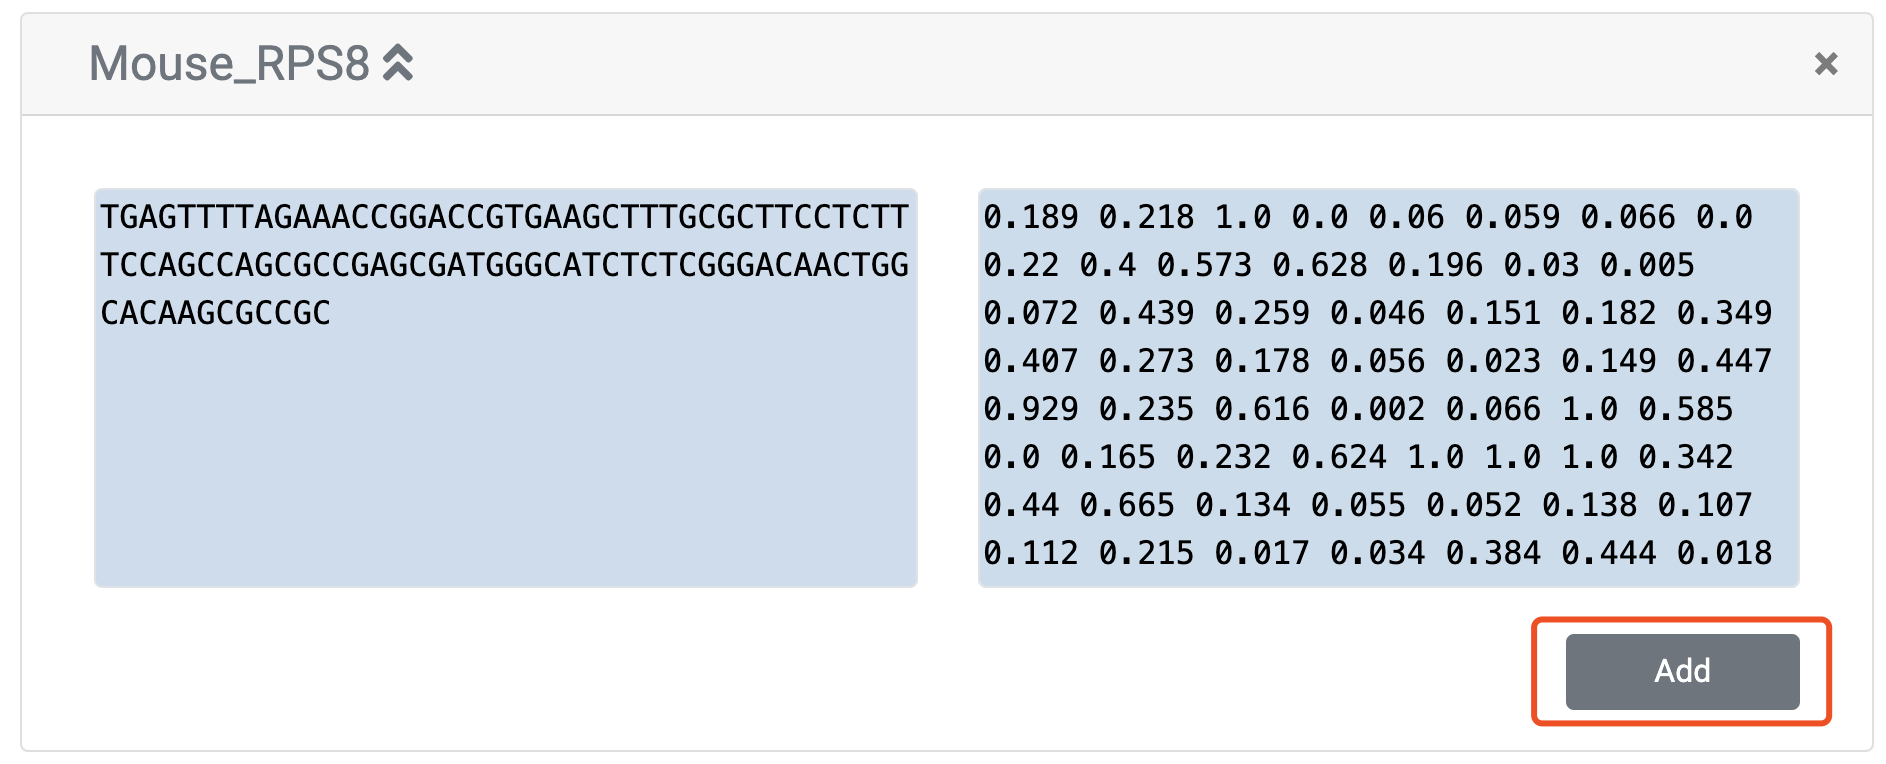
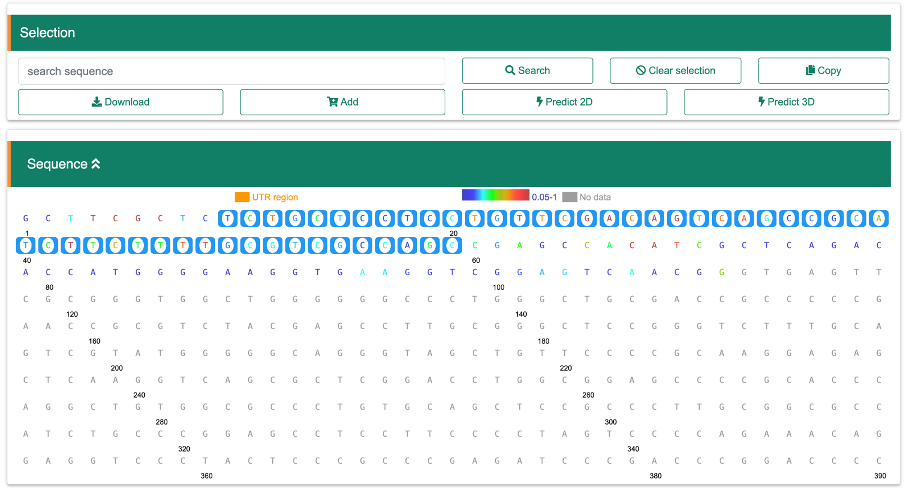
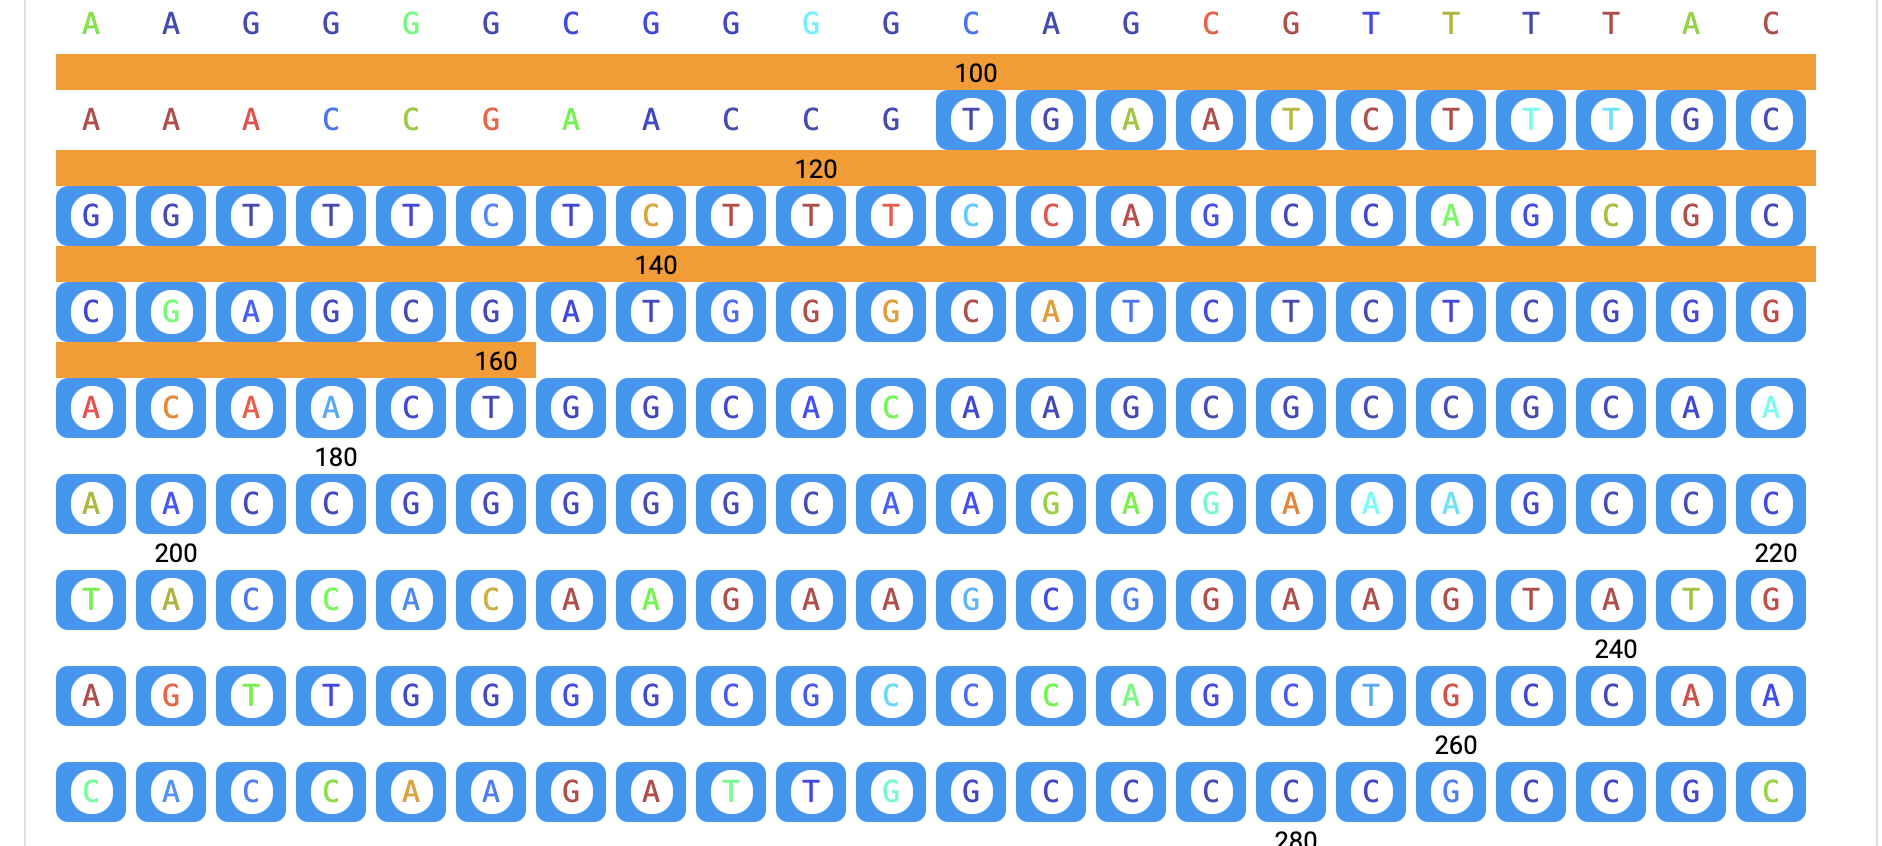
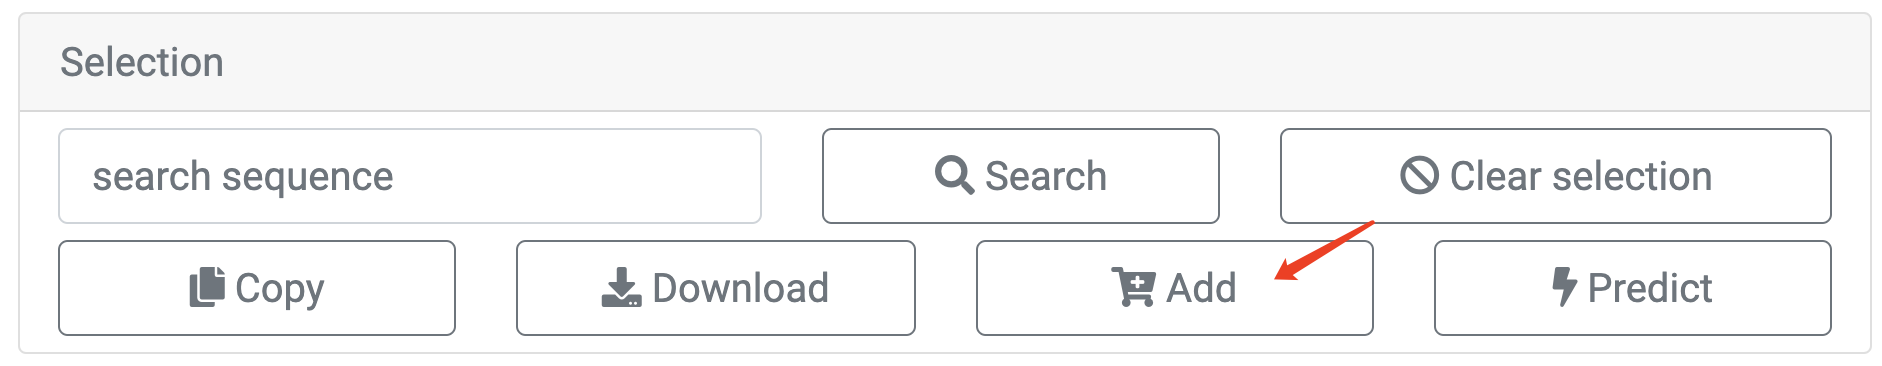
Navigate to the "Sequence" pancel in reuslt page, where each base is color-coded based on its structural score. There are two ways to select a specific region for score analysis. You can either input the exact base sequence of interest and click the "Search" button, or you can directly select the start and end bases of the sequence by clicking on them. Once the end base is clicked, the sequence between the first and last bases (inclusive) will be selected. You can then click the "Copy" button to copy the selected sequence. Additionally, you can download the data, including the base sequence and corresponding scores, by clicking the "Download" button. If you wish to select another region, first press the "Clear selection" button. If you want to copy structure probing data stored in RASP v2.0 to the analysis module directly, the "Add" button will be very helpful.
ExampleStep 1: Go to summary page of intersted transcript from search page
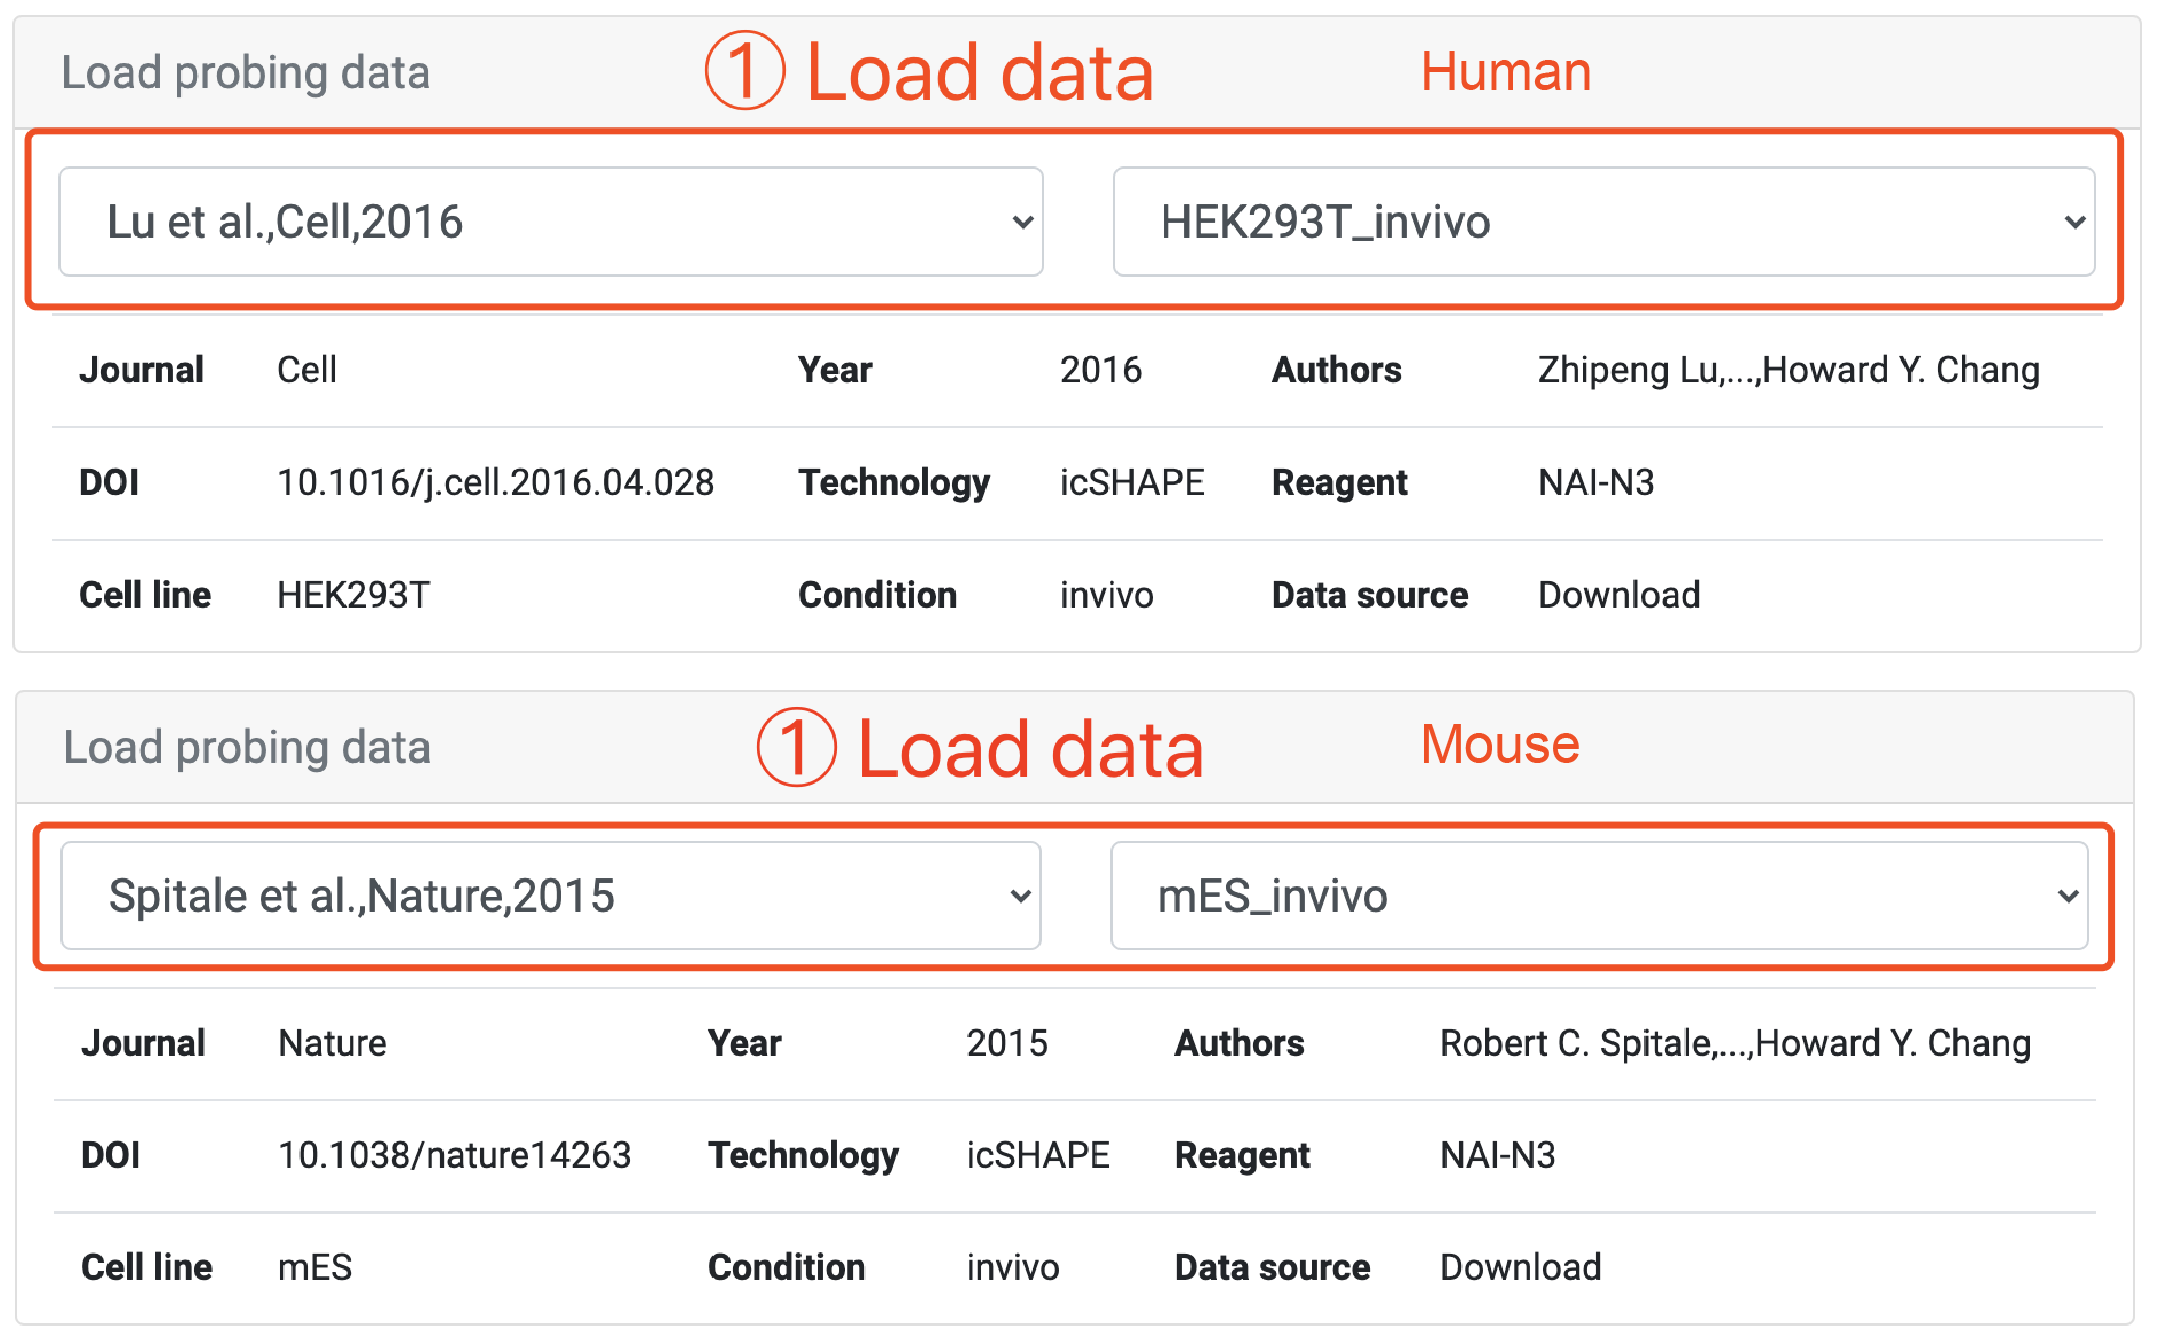
Step 2: Scroll to Load probing data panel and select the dataset
Step 3: After the structure score loaded, scroll to Sequence panel and select a region.
Step 4: Click the Add button to save the sequence and structure score.
Step 5: Go to analysis moedule and load intersted sequence and structure score to input box.